
![]()
Snellen chart
The Snellen chart is the classic tool for testing distance vision (visual acuity) and remains a cornerstone of eye examinations worldwide.
Dutch ophthalmologist Herman Snellen (1834–1908) introduced optotypes, purpose-designed letters drawn on a 5×5 grid to maintain consistent proportions. Each letter is sized so that its height subtends an angle of five minutes of arc at the test distance, with individual strokes subtending one minute of arc. Snellen introduced a formula to express visual acuity the Snellen fraction (d/D). This approach allowed visual acuity to be expressed as a simple fraction (e.g., 6/6), and brought uniformity to what had previously been an inconsistent and subjective practice.:

- v = acuteness of vision
- d = distance at which the test is performed (usually 6 m or 20 ft)
- D = distance at which a normal eye can read the letter
The formula for the acuteness of vision (v) is expressed by the utmost distance at which the types are recognized (d), divided by the distance at which they are seen at our standard angle of five minutes (D). The distances are taken by french metrical measure.
The test distance is usually 20 feet (6 meters), because at this distance light rays entering the eye are nearly parallel, minimizing the need for accommodation. A normal eye should distinguish a gap or stroke that forms an angle of 1 minute of arc at the retina (the minimum angle of resolution).
Before Snellen’s innovation, visual acuity assessment lacked uniformity; clinicians used printed text or informal objects such as mustard seeds or stars. Snellen’s success lay in merging scientific optics with clinical practicality, based on the theoretical foundations of his mentor Franciscus Cornelis Donders, who defined accommodation and refractive anomalies.
Today, while logMAR charts (Bailey-Lovie, ETDRS) offer superior accuracy for research, Snellen charts persist worldwide for routine screening due to simplicity and familiarity.
- 20/20 (6/6) vision: You can read at 20 ft (6m) what a normal eye reads at 20 ft (6m) → normal vision.
- 20/40 (6/12) vision: You can read be at 20 ft (6m) what a normal eye can see at 40 ft (12m) → reduced acuity.
- 20/200 (6/60) vision: You can read at 20 ft (6m) what a normal eye reads at 200 ft (60m) → severe vision impairment.
For context: the largest letter on the Snellen chart (20/200 or 6/60 line) is about 3.5 in (8.9 cm) high at 20 ft (6 m), while the 20/20 (6/6) letters are only 0.35 in (8.9 mm) tall. The heights are designed so that the strokes subtend one minute of arc and the entire letter five minutes of arc at the specified distance
History of visual acuity testing
1674 – Robert Hooke (1635–1703) discussed the eye’s inability to distinguish parts when their apparent size falls below a certain angle, introducing the idea that vision depends on angular separation and estimated the limit of normal visual resolution as one minute of arc.
…such is the make of the sensible part of the Eye, viz. of the Tunica Retina, that it cannot distinguish in most Eyes an Angle less than a Minute (though there be some that can to the third of a Minute, but these are very few)…
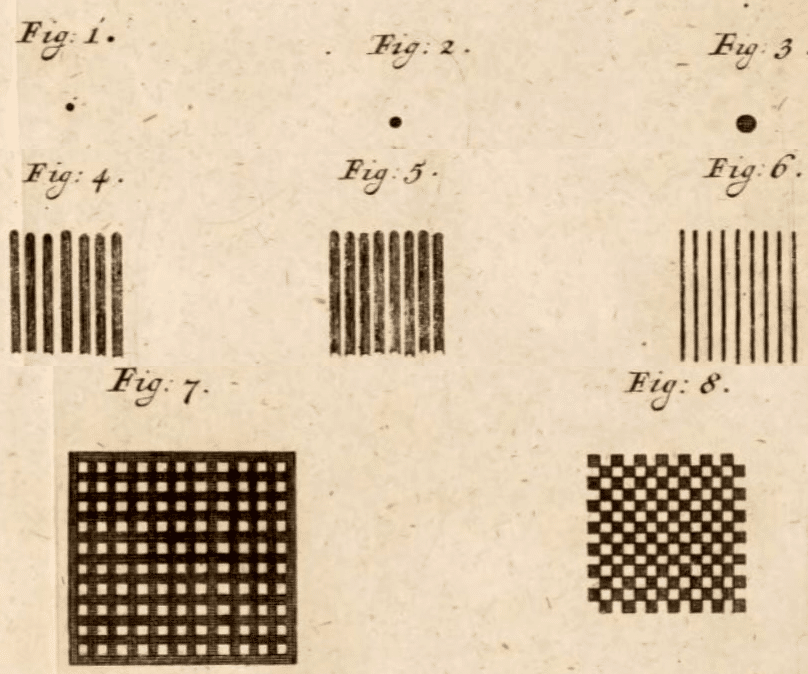
1754 – Tobias Mayer (1723–1762) published Experimenta circa visus aciem including Experimenta de visus acie, objectis luce diurna illustratis. Mayer systematically studied visual acuity using dots, lines, and grids on white paper to determine the limits of visual acuity (terminus visionis). He expressed acuity in arcseconds and distinguished between “primary” acuity (isolated objects) and “secondary” acuity (crowded objects), a concept anticipating modern research on visual crowding
1843 – Heinrich Küchler (1811–1873) was the first to publish printed vision-test charts in 1843, introducing the Schriftnummerprobe für Gesichtsleidende (printed number and text samples for those with eye disease). In 1844, he followed with a landmark paper, Ueber den Zweck und die beste Einrichtung von Gesichtsproben which emphasized global standardization and defined the essential qualities of test objects as:
- Universal comprehension (independent of literacy).
- Differ only by size and visual angle, not by shape or ornamentation.
- Ease of reproduction for consistency across clinics.
1854 – Eduard Jaeger Ritter von Jaxtthal (1818–1884) introduced his Schrift-Scalen (test types) in 1857 as the first standardized near-vision test. Printed by the Imperial and Royal State Printing House (Staatsdruckerei) in Vienna, the booklet contained multiple paragraphs in different fonts and sizes, ranging from No. 1 (smallest) to No. 20+ (largest). Texts were published in English, German, French, Russian and Latin, reflecting Jaeger’s intent to simulate real-world reading rather than isolated symbols.
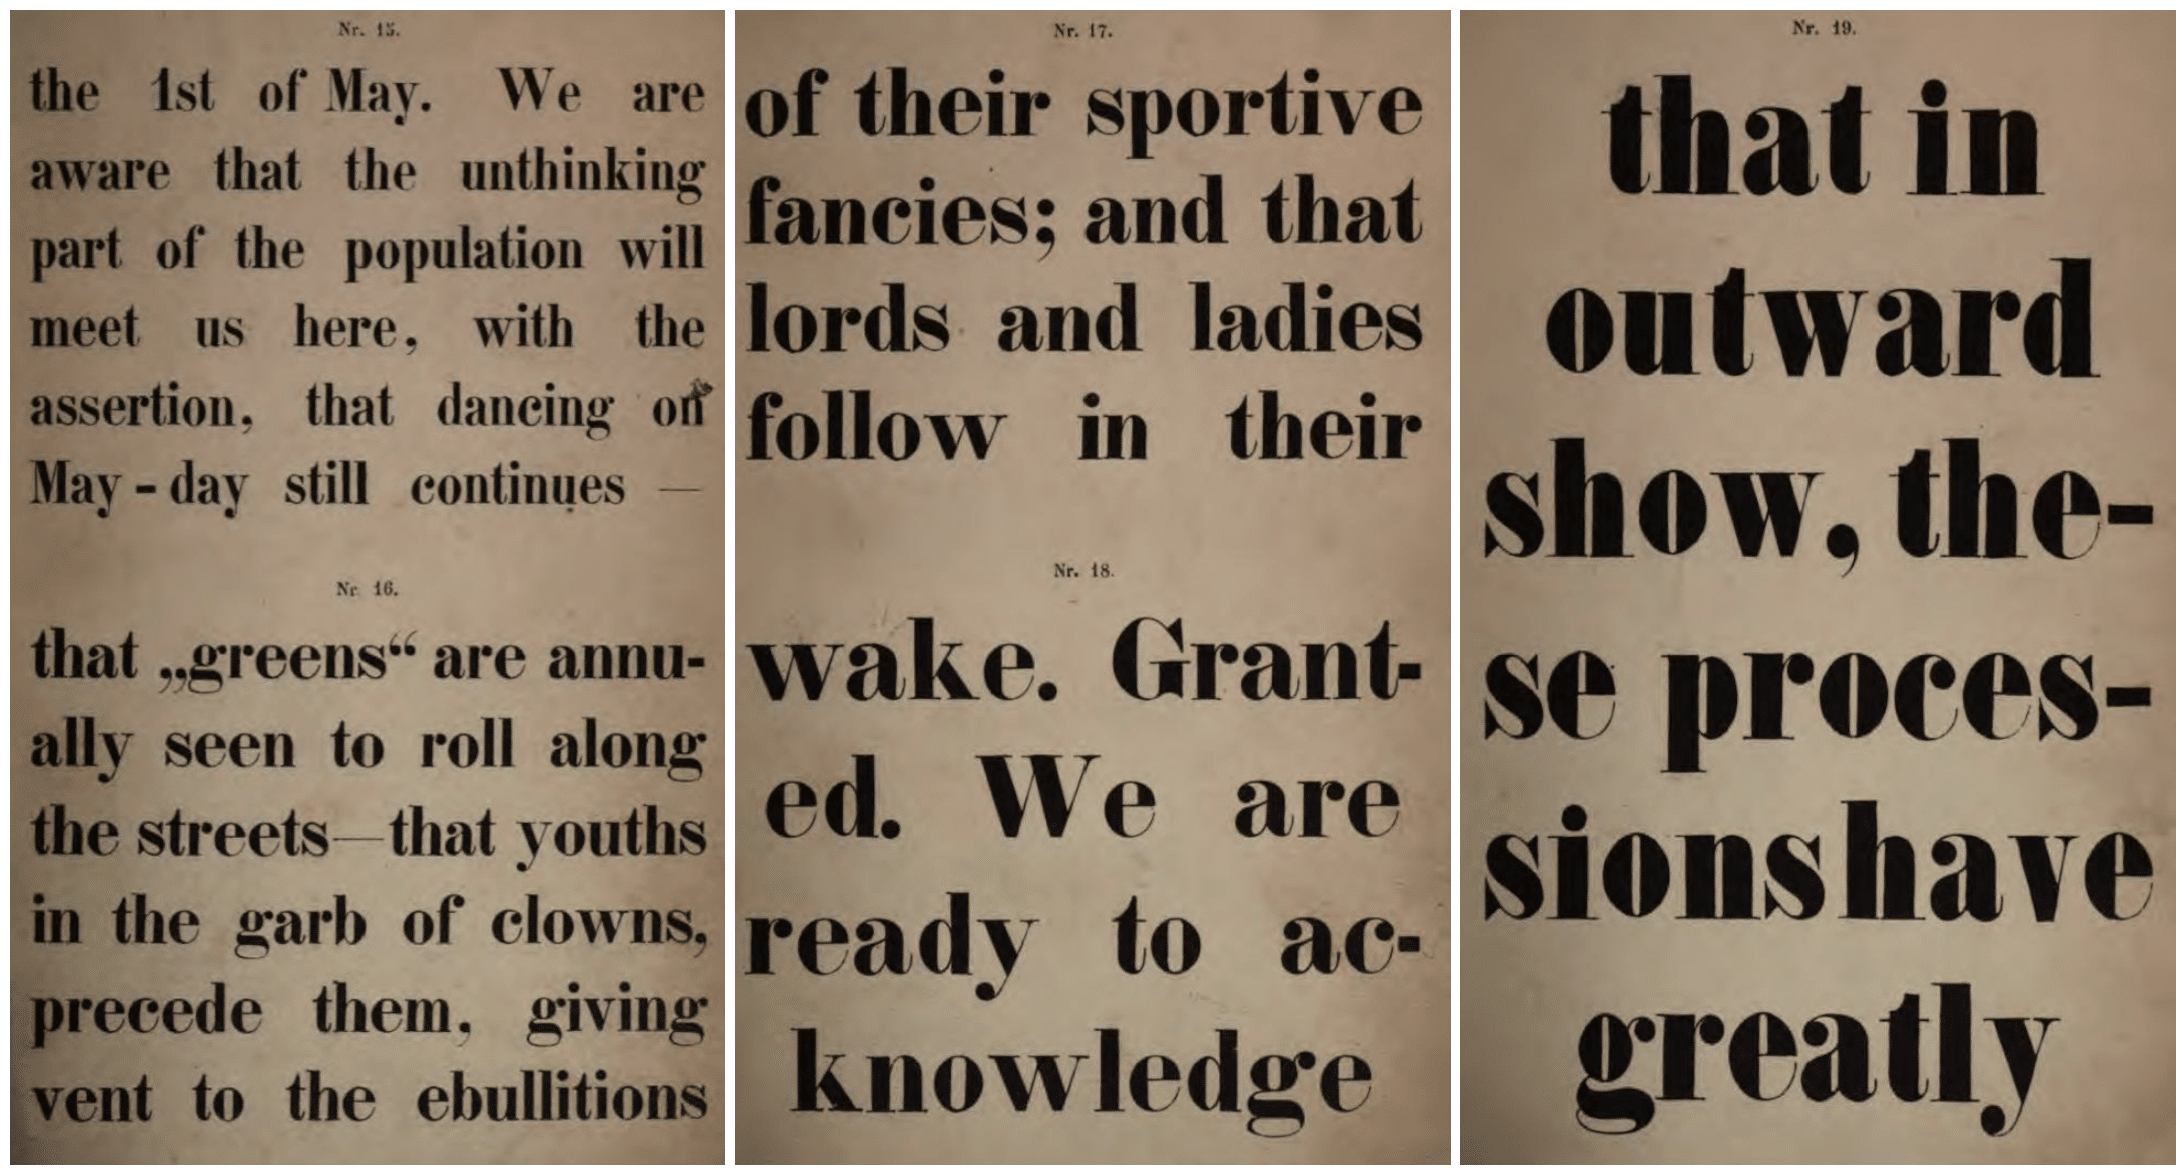
Schrift-Scalen provide the physician with a practical means to estimate reading vision in a way true to daily life, using ordinary print and connected sentences rather than detached letters or meaningless characters.
1861 – Franciscus Cornelis Donders (1818–1889) formalized the concept of visual acuity as the minimum angle of resolution and advocated standardized testing methods.
1862 – Herman Snellen (1834–1908) published his optotypes and Snellen fraction (d/D) in Letterproeven tot bepaling der gezichtsscherpte (Test Letters for Determining Visual Acuity) and Optotypi ad visum determinandum (Optotypes for the determination of the acuteness of vision)
The letters should be constructed on a square, and each part of the letter should be of uniform thickness and proportional length, so that its recognition depends solely upon the sharpness of the vision, and not upon its form or ornamentation.
Square letters whose limbs have a width equal to one fifth of the letters height are generally distinctly visible to a normal eye at an angle of five minutes.
1874 – Snellen and Edmond Landolt (1846–1926) collaborated on methods for measuring visual acuity with Ophthalmometrologie. Die Functionsprüfungen des Auges in the Graefe–Saemisch Handbuch.
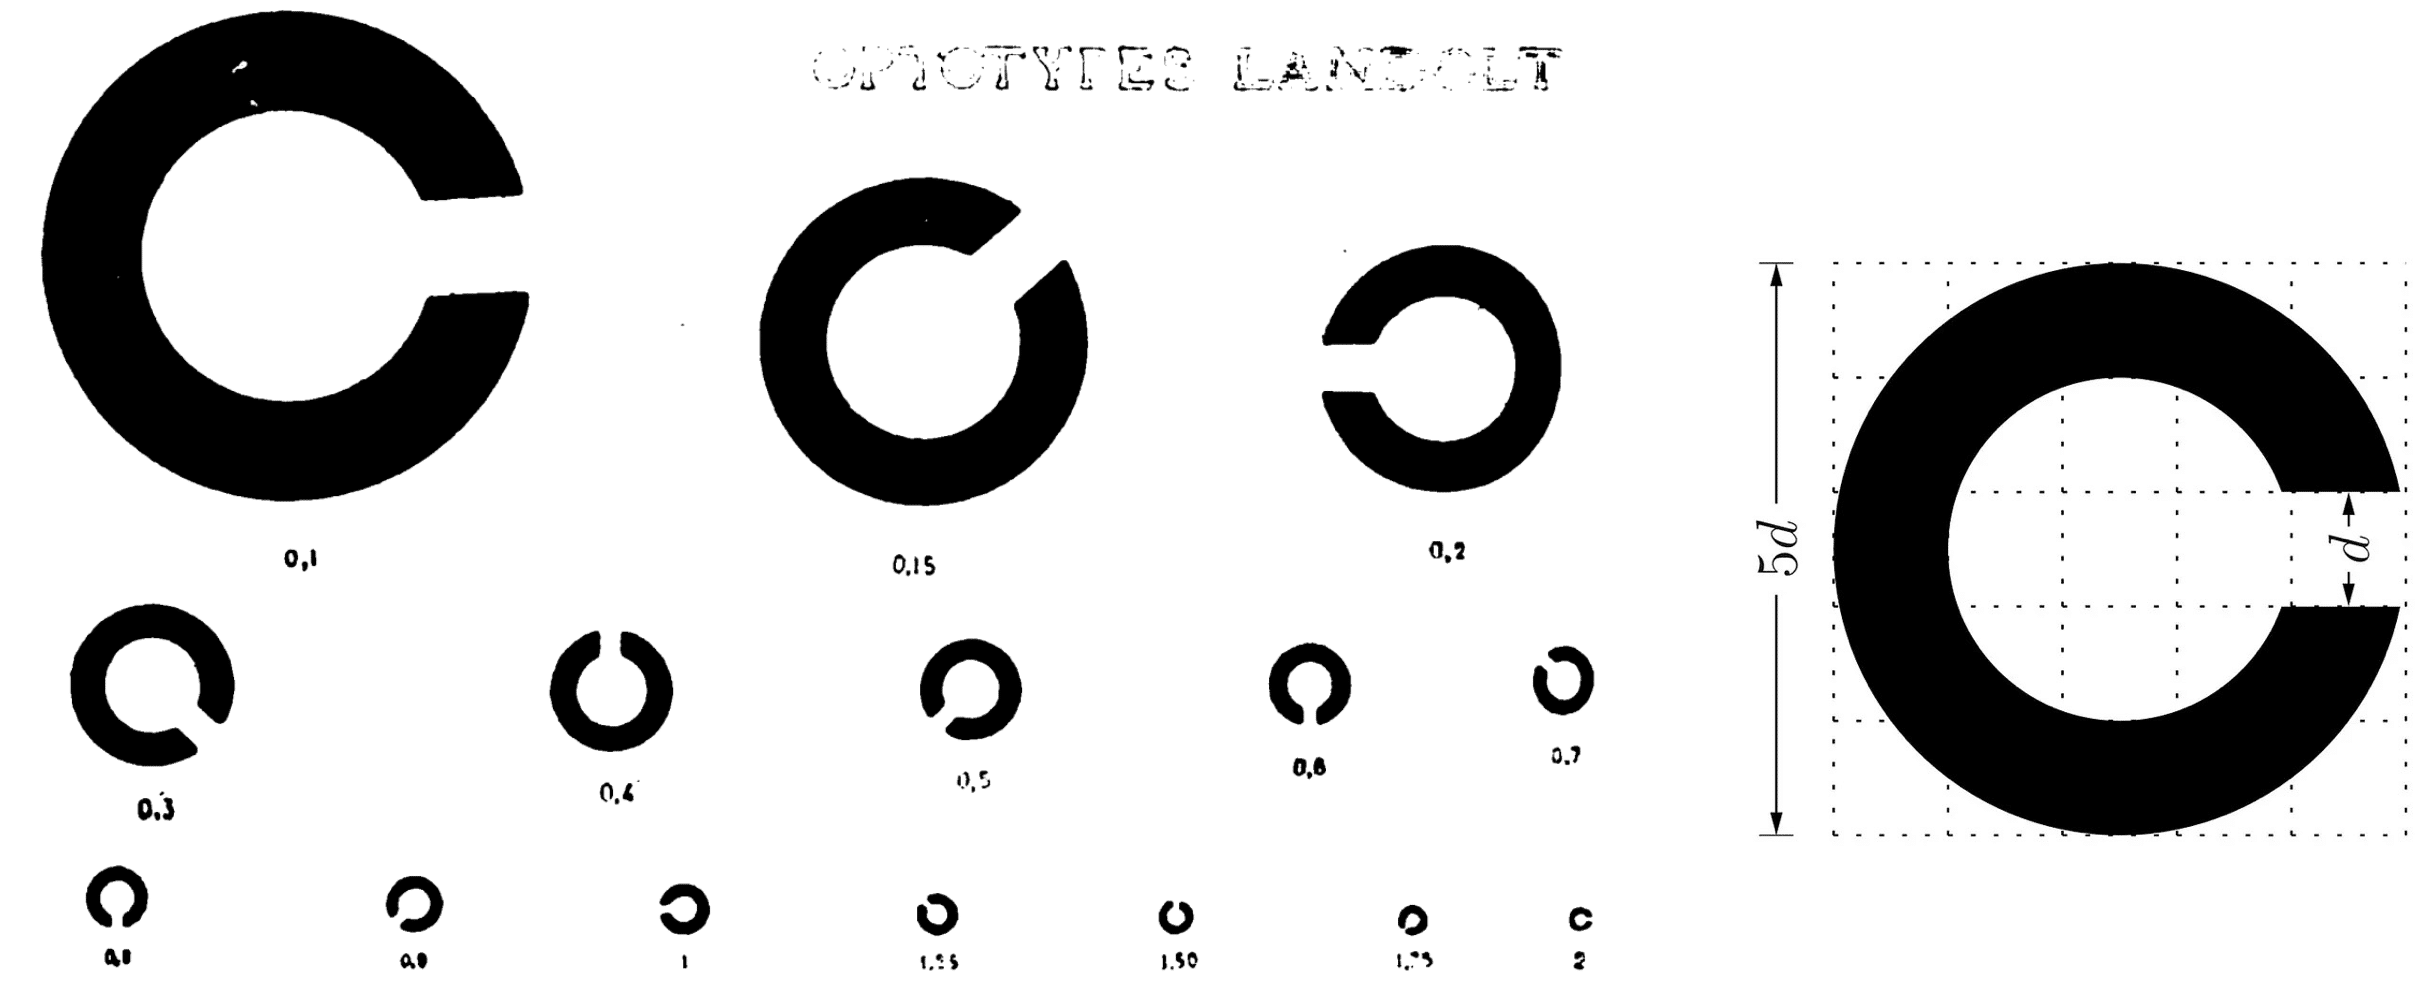
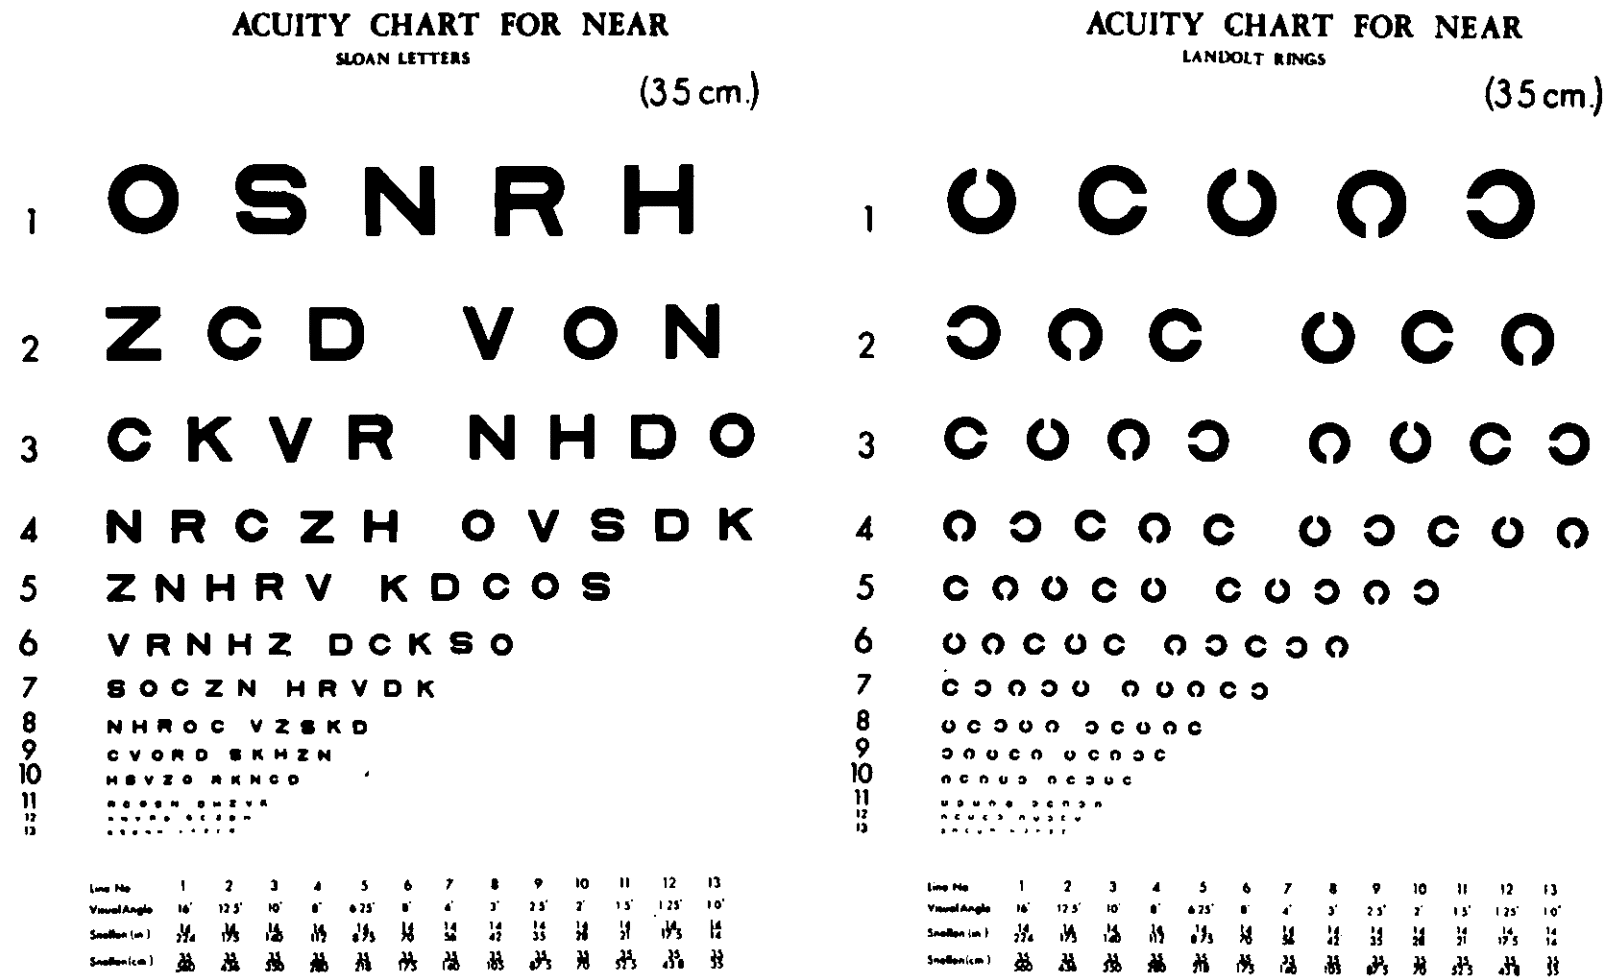
1899 – Landolt introduced the Landolt C (or Landolt ring) as a universal optotype in hispaper Nouveaux objets-types pour la détermination de l’acuité visuelle. Designed to eliminate literacy bias and provide a reproducible standard, the Landolt C consists of a broken ring with a gap at one of eight orientations.
The Landolt C remains the international reference optotype, adopted in DIN 58220 and ISO 8596 standards and is preferred in research and regulatory testing for its precision and neutrality across languages.
Original
English
Ces objets-types sont basés sur ce principe adopté partout: déterminer le plus petit angle sous lequel l’œil distingue deux points comme étant séparés. L’écartement des deux points est représenté par une solution de continuité dans des cercles noirs sur fond blanc.
L’anneau interrompu, dont l’ouverture se présente dans diverses directions, offre un objet-type qui réunit simplicité et précision
Standard symbols have been used to determine the smallest angle at which the eye distinguishes two points as separate. Here, the distance between the two points is represented by a break in continuity in black circles on a white background.
The interrupted ring, with an opening presented in various directions, provides a test object that combines simplicity and precision
1909 – International Congress of Ophthalmology made the first formal attempt to standardize vision testing, though widespread clinical uptake was slow.
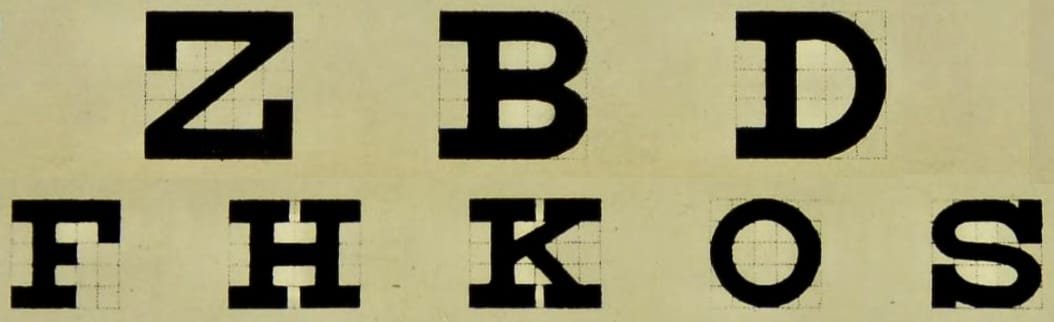
1959 – Louise Luttig Sloan (1908–1983) developed Sloan optotypes, still used in ETDRS charts and introduced the M-unit system for low-vision assessment. Sloan recognized variability in recognition difficulty among Snellen letters. Proposed using ten letters designed on a 5×5 grid [Distance chart][Near chart]
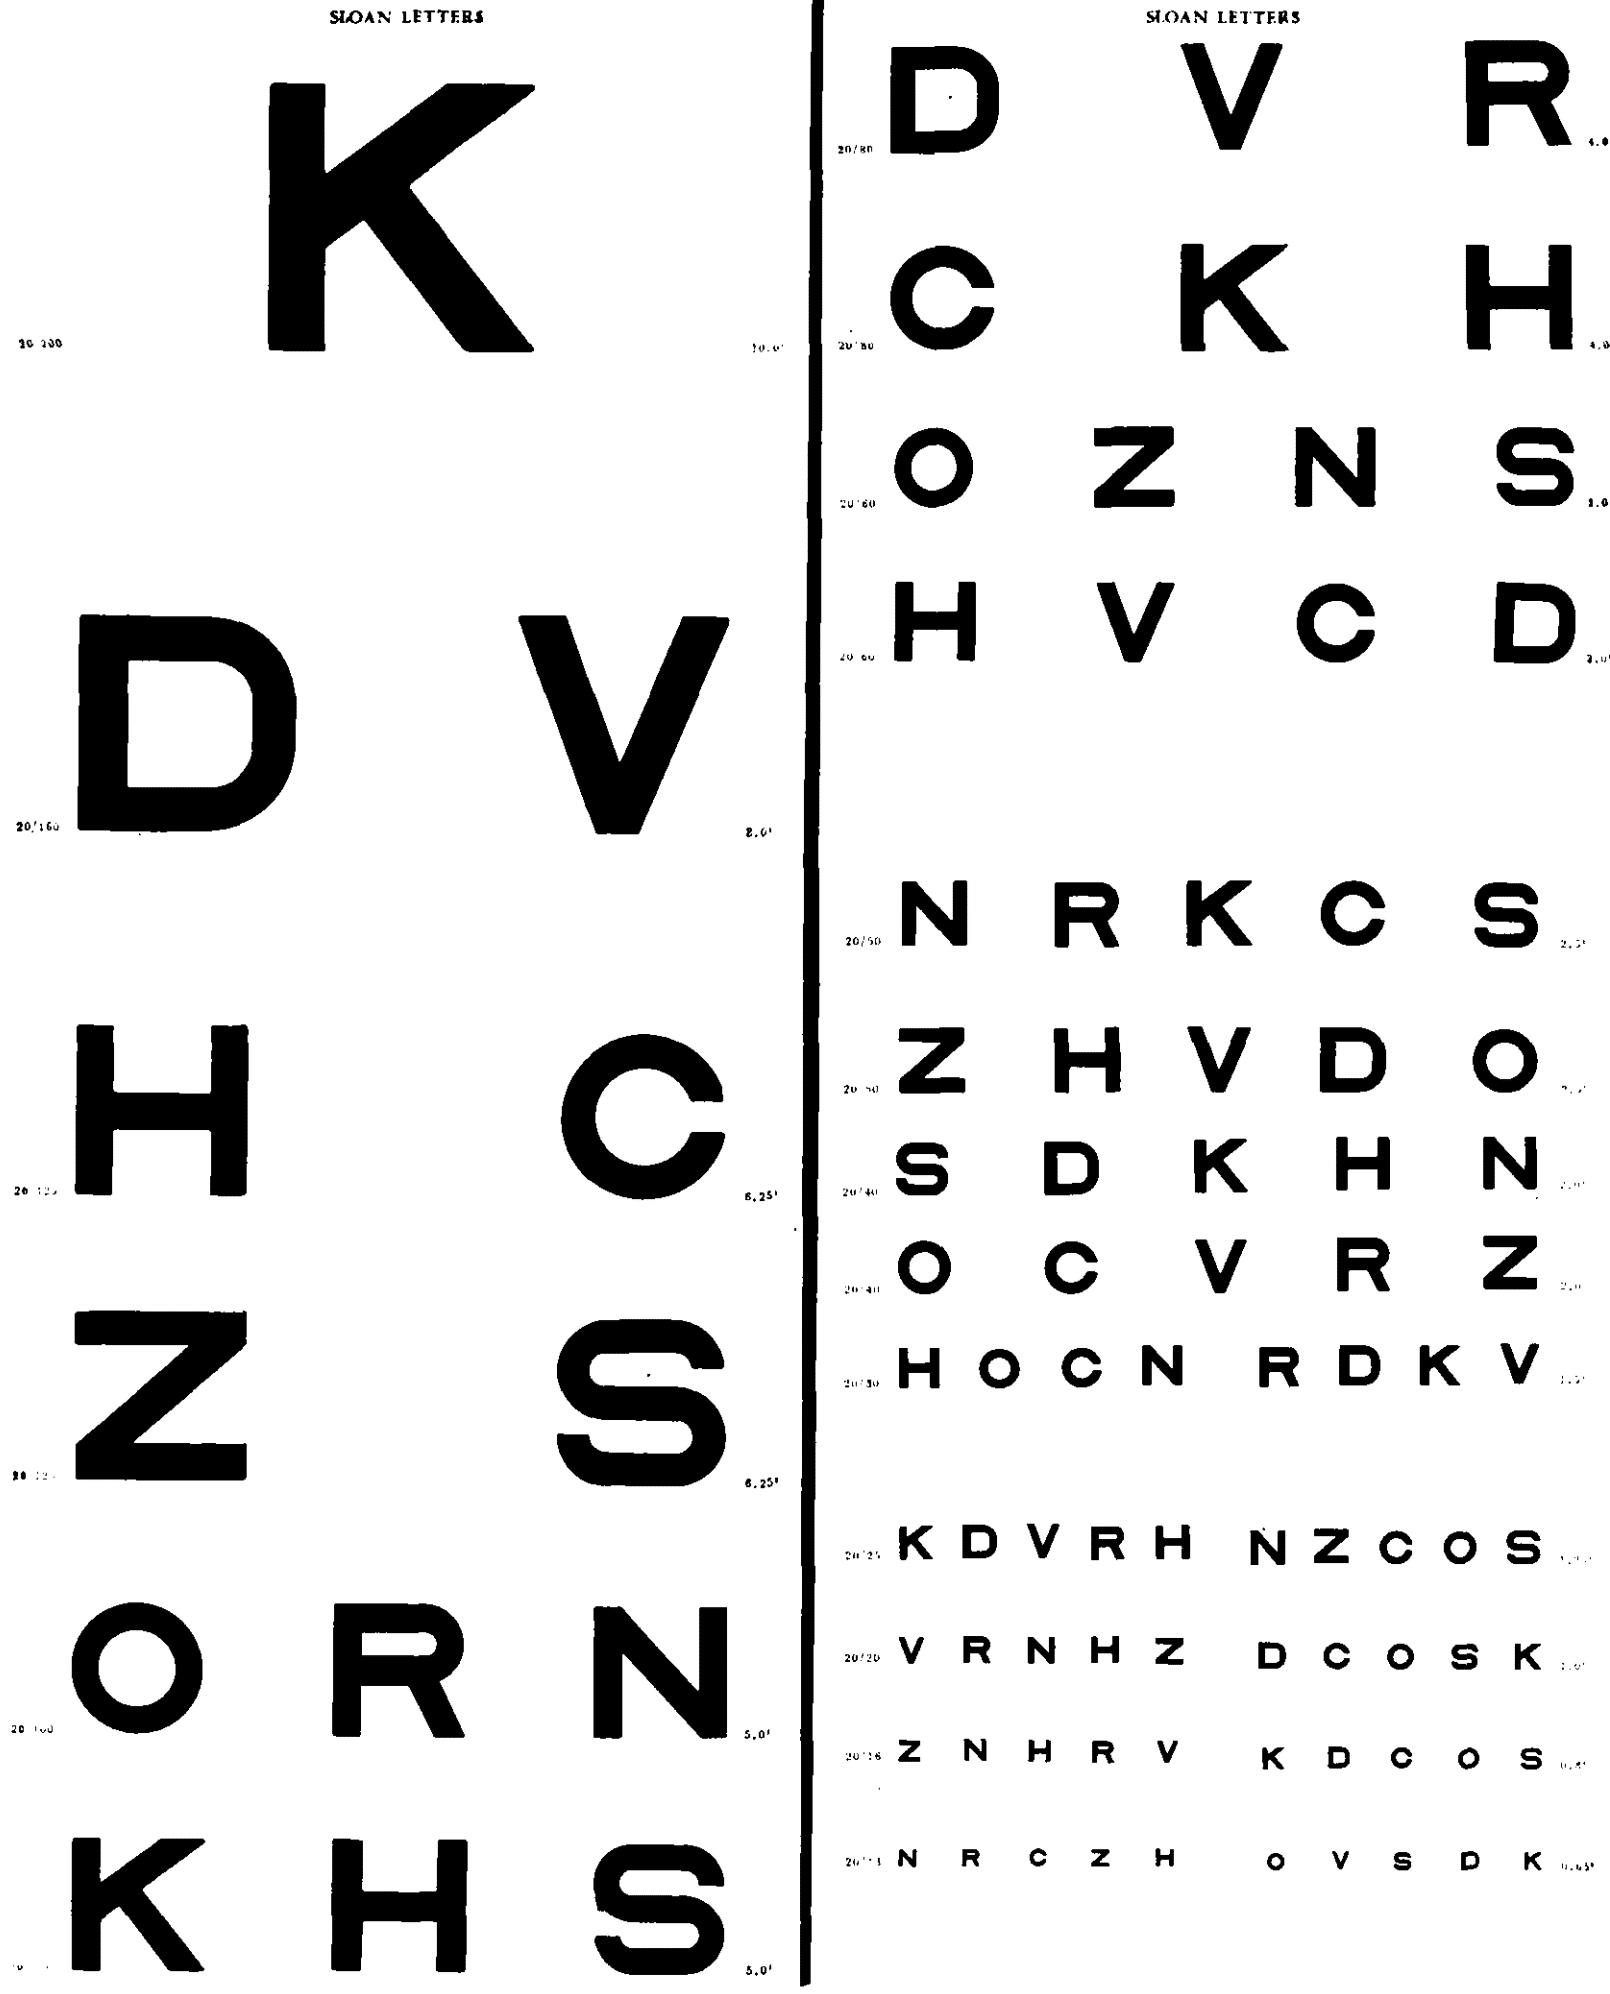
The optotypes recommended for testing literate subjects are a specially selected set of 10 capital letters, namely Z N H R V K D C O S… Experimental evidence suggests that these letters are about as nearly equal in legibility as can be obtained when simple capital letters of familiar form are used
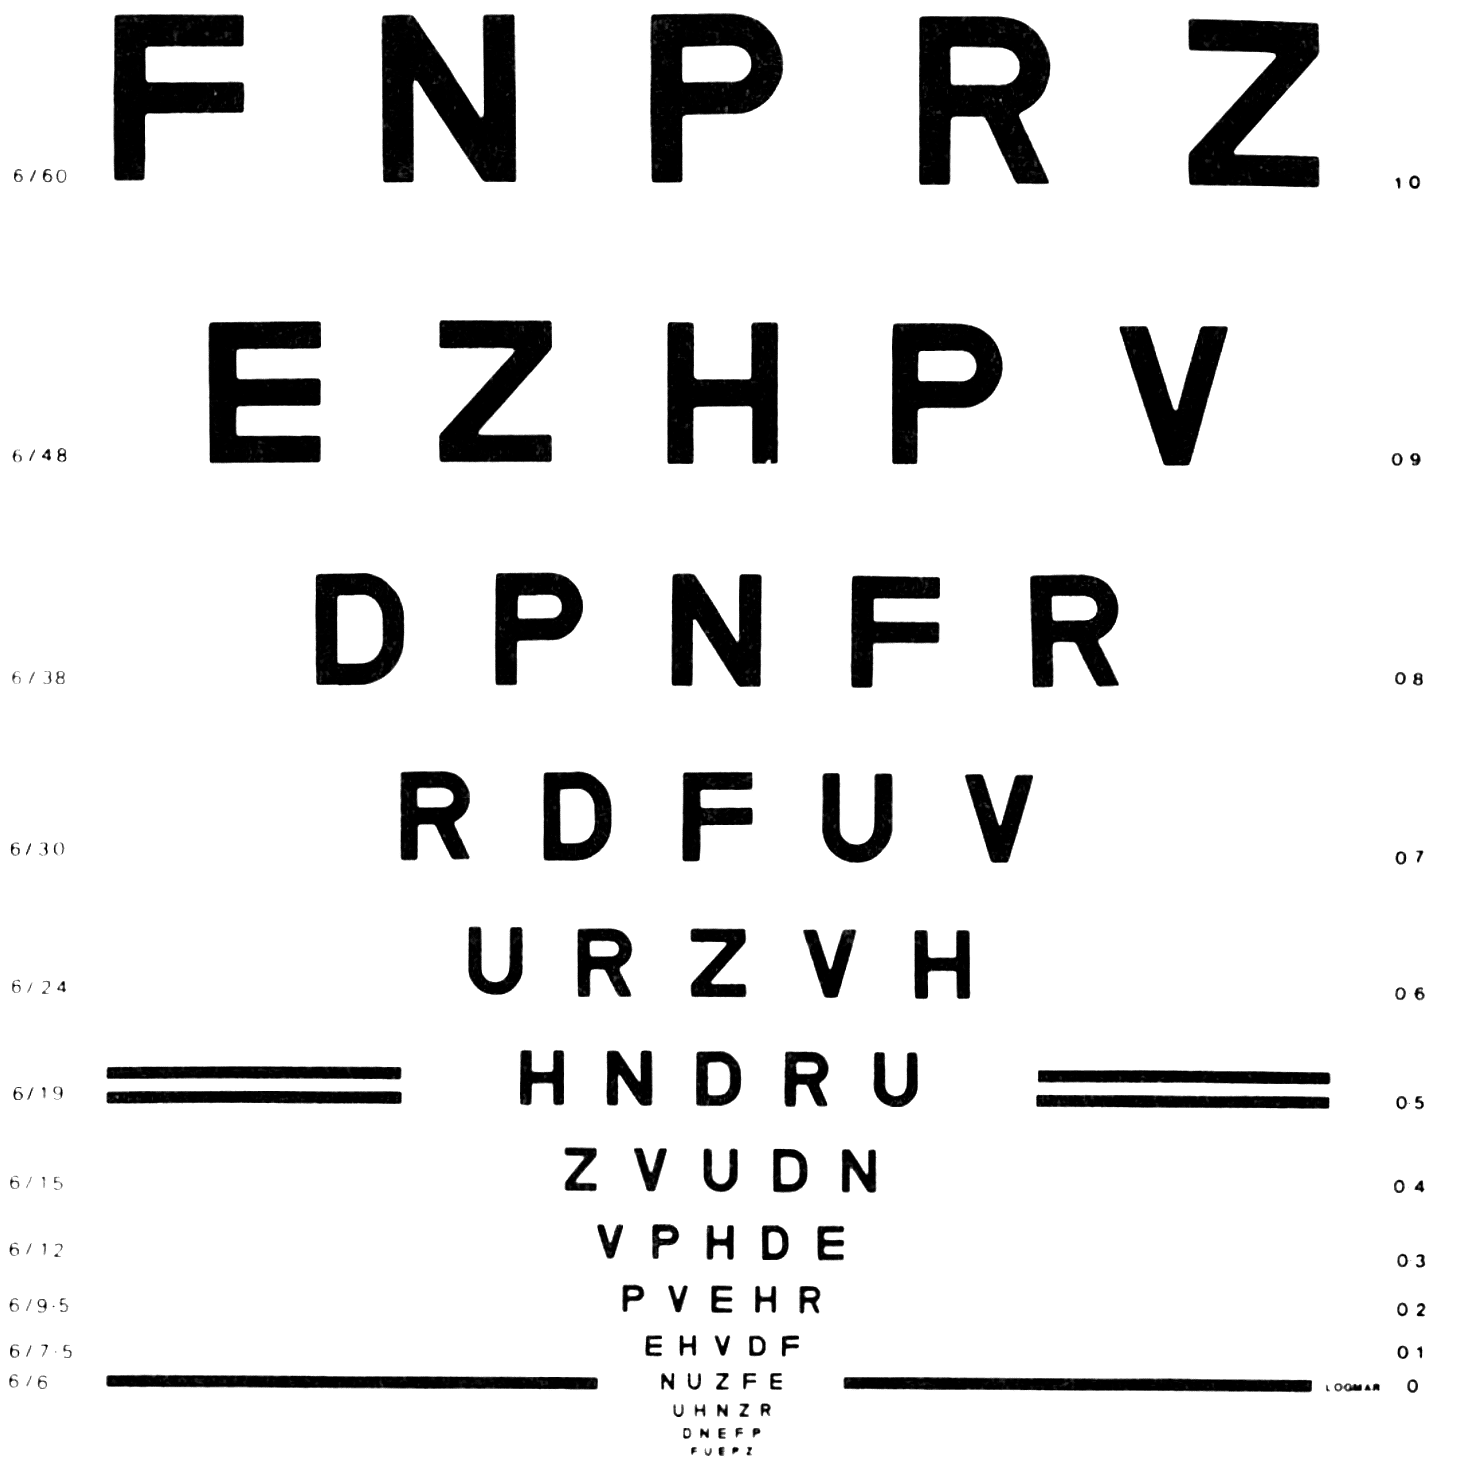
1976 – Ian L. Bailey (b.1940s) and Jan E. Lovie (b.1940s) introduced a groundbreaking chart design in New design principles for visual acuity letter charts, emphasizing standardization and psychophysical accuracy. Their innovations included:
- Equal number of letters per row (5),
- Logarithmic progression of letter sizes (0.1 logMAR steps),
- Uniform spacing between letters and rows,
- Use of Sloan letters for consistent legibility,
- Dual labeling in Snellen and logMAR units.
The chart allowed reliable scoring at nonstandard distances, ideal for low-vision assessment and malingering detection.
The most basic principle is that the visual acuity task for all letter sizes should be practically the same and should remain so when nonstandard viewing distances are used.
1982 – Based on the Bailey–Lovie design, the ETDRS (Early Treatment Diabetic Retinopathy Study) chart was introduced to standardize vision measurement for clinical trials. Key attributes include:
- Use of Sloan letters (consistent legibility),
- LogMAR scoring, ensuring uniform progression and accurate change detection,
- Rigorous illumination and distance specifications,
- Designed for multi-center reproducibility in research settings.
The ETDRS chart implemented the layout of the Bailey–Lovie chart with Sloan letters… Both follow the same logarithmic progression… standardized method for measuring visual acuity for the Early Treatment of Diabetic Retinopathy Study (ETDRS).
Associated Persons
- Herman Snellen (1834–1908) – Dutch ophthalmologist who introduced the Snellen chart in 1862, standardizing visual acuity measurement using geometric optotypes and the Snellen fraction.
- Frans Cornelis Donders (1818–1889) – Mentor to Snellen and pioneer in physiological optics; laid the theoretical groundwork for VA testing and refractive error classification.
- Robert Hooke (1635–1703) – Early experimentalist in optics; described limitations of human vision in angular terms (minute of arc) in Micrographia and posthumous works.
- Tobias Mayer (1723–1762) – German mathematician and astronomer; in 1754, measured resolution limits using dots and lines, expressing VA in arcseconds, anticipating visual crowding effects.
- Heinrich Küchler (1811–1873) – German physician; designed one of the first systematic printed VA tests using blackletter type and advocated for standardized optotypes in 1843–1844.
- Eduard Jaeger von Jaxtthal (1818–1884) – Austrian ophthalmologist; developed Jaeger near vision charts in the 1850s using printed text passages, popularizing near-vision testing.
- Edmond Landolt (1846–1926) – French ophthalmologist; introduced the Landolt C (broken ring) in 1899 as a language-independent international optotype standard.
- Louise L. Sloan (1898–1982) – American vision scientist; developed the Sloan letter set in 1959 for optotype uniformity in VA testing.
- Ian L. Bailey (b.1940s) & Jan E. Lovie (b.1940s) – Australian optometrists; created the Bailey–Lovie logMAR chart in 1976 with logarithmic scaling, equal letter spacing, and Sloan letters.
References
Historical references
- Hooke R. Lectures in light In: The posthumous works of Robert Hooke. 1705
- Mayer T. Experimenta circa visus aciem. Commentarii Societatis Regiae Scientiarum Gottingensis. 1754; 4: 97-110
- Stampfer S. Ueber die Genauigkeit des Visirens bei Winkelmessungen. Jahrbücher des kaiserlichen königlichen polytechnischen Institutes in Wien. 1834; 18: 211–36.
- Jaeger E. Prüfung des Sehvermögens bei Gesunden wie Kranken In: Ueber Staar und Staaroperationen nebst anderen Beobachtungen und Erfahrungen. Wien: Seidel; 1854: 110-128.
- Küchler H. Schriftnummerprobe für Gesichtsleidende. Darmstadt: Diehl; 1843
- Küchler H. Ueber den Zweck und die beste Einrichtung von Gesichtsproben. Medicinische Annalen 1844; 10: 408-418.
- Snellen H. Probebuchstaben zur Bestimmung der Sehschärfe. 1862 [German]
- Snellen H. Test-types for the determination of the acuteness of vision. 1862 [English]
- Snellen H. Optotypi ad visum determinandum. 1862
- Snellen H, Landolt E. Ophthalmometrologie. Die Functionsprüfungen des Auges. In: Handbuch der gesammten Augenheilkunde [Eds Graefe A, Saemisch T. ] 1874
- Landolt E. Nouveaux opto-types pour la détermination de l’acuité visuelle. Archives d’Ophtalmologie 1899; 19: 465-471
- Sloan LL. New test charts for the measurement of visual acuity at far and near distances. Am J Ophthalmol. 1959 Dec;48:807-13.
- Bailey IL, Lovie JE. New design principles for visual acuity letter charts. Am J Optom Physiol Opt. 1976 Nov;53(11):740-5
- Ferris FL 3rd, Kassoff A, Bresnick GH, Bailey I. New visual acuity charts for clinical research. Am J Ophthalmol. 1982 Jul;94(1):91-6.
Eponymous term review
- de Jong PTVM. A history of visual acuity testing and optotypes. Eye (Lond). 2024 Jan;38(1):13-24.
eponymictionary
the names behind the name
BA MA (Oxon) MBChB (Edin) FACEM FFSEM. Emergency physician, Sir Charles Gairdner Hospital. Passion for rugby; medical history; medical education; and asynchronous learning #FOAMed evangelist. Co-founder and CTO of Life in the Fast lane | On Call: Principles and Protocol 4e| Eponyms | Books |
BSc, MD (UWA), MPH (UNSW). Emergency Physician in training. German translator and lover of medical history.