![]()
Electrocardiographic Exigency
aka ECG Exigency 001
A 23 year-old man is brought in by paramedics after an episode of syncope at home. On arrival he is in severe respiratory distress, extremely pale and dripping with sweat. B
P is 125/70, HR is 80bpm, RR 40, SaO2 95% on 15L O2 via NRB. Portable CXR in resus is normal.
His ECG is presented below:
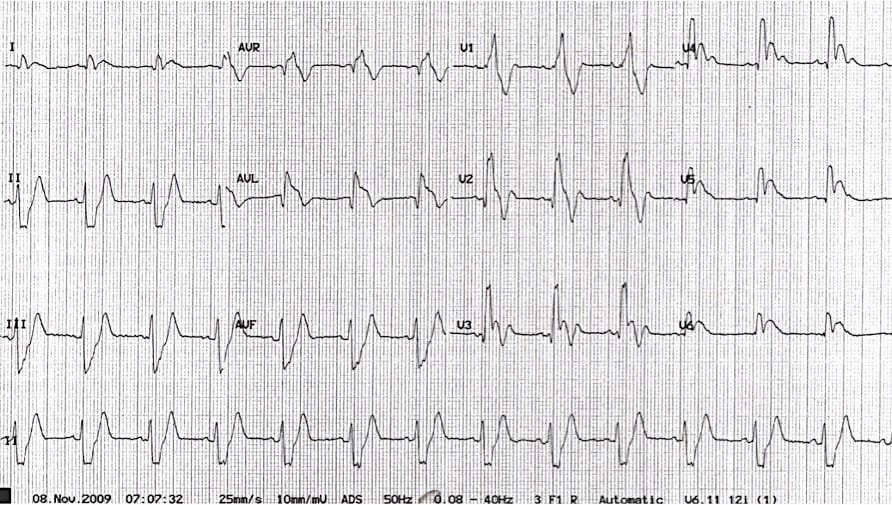
Q1. Describe the ECG
Answer and Interpretation
- Sinus rhythm at 80 bpm
- Left axis deviation (-70 degrees)
- RBBB with wide QRS (150ms), tall R wave in V1, RSR’ complexes in leads V1-3
- Right ventricular strain pattern with deep T wave inversions in V1-3
- Widespread ischaemic changes with 1-2mm ST elevation and early Q waves in the anterior leads (V2-5) and 1-2 mm ST depression in inferior leads (II, III and aVF). There is also significant ST elevation in leads aVR and aVL with formation of Q waves.
Q2. What is your interpretation of the ECG findings given the clinical context?
Answer and Interpretation
- The combination of new RBBB with signs of right ventricular strain (deep T wave inversions in V1-3) in a patient presenting with dyspnoea and syncope is strongly suggestive of acute pulmonary hypertension secondary to massive PE.
- Widespread myocardial ischaemia/infarction is likely related to severe global tissue hypoxia from obstructive shock (VBG in this patient showed venous saturations of 10%, venous PO2 10mmHg with a lactate of 8mmol/L).
- Left axis deviation may represent left anterior fascicular block.
…and then what happened?
- Shortly after this ECG was taken, the patient lost consciousness and had a PEA arrest from which he was unable to be resuscitated.
- Bedside echocardiogram performed during the resuscitation attempt showed a grossly dilated right ventricle and partially collapsed left ventricle with deviation of the interventricular septum to the left.
- Post-mortem examination confirmed a large saddle pulmonary embolus with complete obstruction of the pulmonary trunk.
- Previous hospital notes showed a history of thrombophilia and two previous episodes of venous thromboembolism.
Q3. What other ECG changes may be seen in this condition?
Answer and Interpretation
ECG changes are all fairly insensitive for the diagnosis of PE, and in most patients with PE the ECG will be normal.
The following ECG changes may be seen in acute pulmonary embolism:
- Sinus tachycardia
- SI QIII TIII – deep S wave in I, Q wave in III, inverted T wave in III
- Complete or incomplete RBBB
- Right axis deviation
- Right ventricular strain pattern: T wave inversions in V1-3, sometimes extending to V4
- Simultaneous T wave inversions in the inferior (II, III, aVF) and right precordial leads (V1-3).
- Right atrial enlargement (“P pulmonale”): peaked P wave in lead II > 2mm in height
- Clockwise rotation: shift of the R/S transition point towards V6, persistent S wave in V6
- Atrial tachyarrhythmias: AF, flutter, atrial tachycardia
Extreme right axis deviation may occur, with axis between zero and -90 degrees, giving the appearance of left axis deviation (“pseudo left axis”). Simultaneous T wave inversions in the inferior and right precordial leads is the most specific finding for PE, with reported specificities up to 99% in one study.
Check out Amal Mattu and William Brady’s excellent ECG’s for the Emergency Physician‘ books for some great examples of this.
Q4. What causes ECG changes in this condition?
Answer and Interpretation
ECG changes in PE are related to:
- dilation of the right atrium and right ventricle with consequent shift in the position of the heart
- right ventricular ischaemia
- increased catecholamine levels (which drives the tachyarrhythmias)
References
- de Zwaan C, Bär FW, Wellens HJ. Characteristic electrocardiographic pattern indicating a critical stenosis high in left anterior descending coronary artery in patients admitted because of impending myocardial infarction. Am Heart J. 1982 Apr;103(4 Pt 2):730-6
- Hampton, JR. The ECG In Practice, 6e
- Mattu A, Brady W. ECG’s for the Emergency Physician 1
- Mattu A, Brady W. ECGs for the Emergency Physician 2
- Surawicz B, Knilans T. Chou’s Electrocardiography in Clinical Practice: Adult and Pediatric, 6e
- Wagner, GS. Marriott’s Practical Electrocardiography 12e
Further Reading
- Wiesbauer F, Kühn P. ECG Mastery: Yellow Belt online course. Understand ECG basics. Medmastery
- Wiesbauer F, Kühn P. ECG Mastery: Blue Belt online course: Become an ECG expert. Medmastery
- Kühn P, Houghton A. ECG Mastery: Black Belt Workshop. Advanced ECG interpretation. Medmastery
- Rawshani A. Clinical ECG Interpretation ECG Waves
- Smith SW. Dr Smith’s ECG blog.
- Wiesbauer F. Little Black Book of ECG Secrets. Medmastery PDF
CLINICAL CASES
ECG EXIGENCY
Emergency Physician in Prehospital and Retrieval Medicine in Sydney, Australia. He has a passion for ECG interpretation and medical education | ECG Library |