
![]()
Echo basics: Mitral Stenosis
Grading mitral stenosis
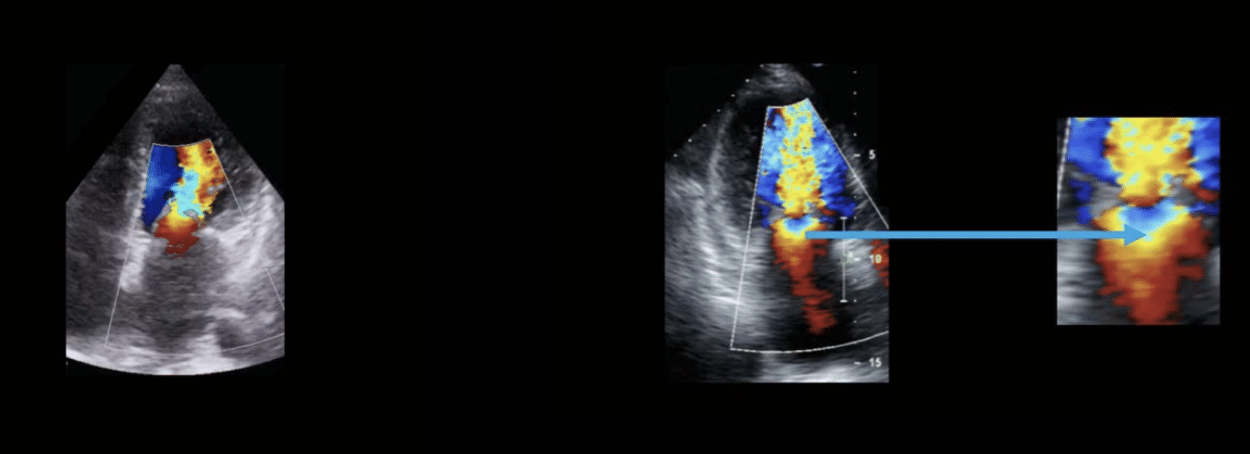
Colour Doppler Appearance
In mitral stenosis, colour Doppler typically shows:
- Flow acceleration toward the valve
- A long diastolic jet extending into the apex of the left ventricle
- A clearly visible PISA (proximal isovelocity surface area) hemisphere in the left atrium, indicating proximal flow convergence
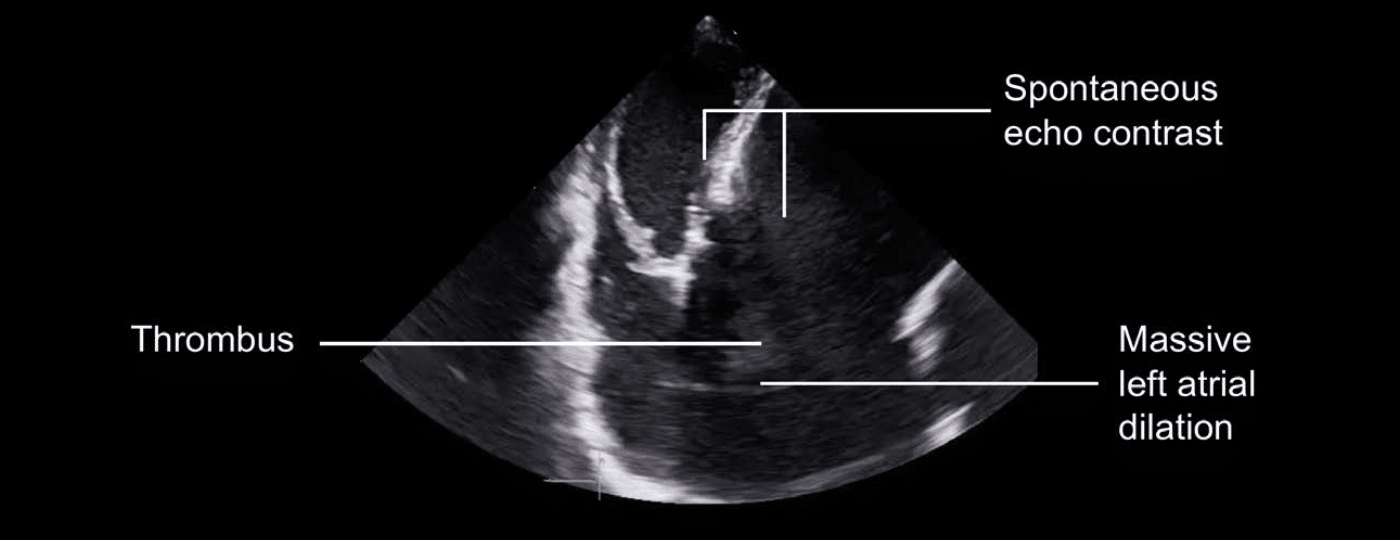
Left Atrial Changes
Chronic mitral stenosis causes sustained elevation of left atrial pressure, leading to:
- Left atrial dilation
- Myocardial fibrosis, reducing atrial contractility
- Blood stasis, particularly in the left atrial appendage, increasing the risk of thrombus formation
- Appearance of spontaneous echo contrast (“smoke-like” effect) as a marker of blood stasis
Pulmonary and Right Heart Effects
Increased left atrial pressure leads to retrograde transmission through the pulmonary veins, which can result in:
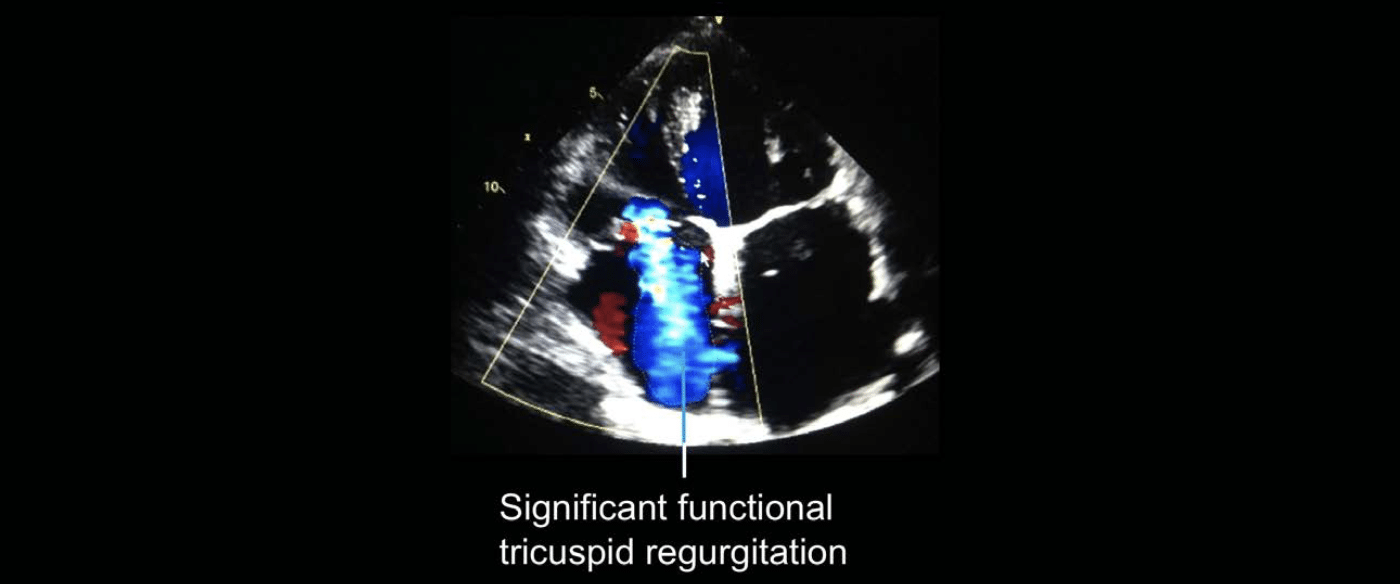
Right-sided heart changes:
- Right atrial dilation
- Right ventricular dilation and dysfunction (due to pressure overload)
- Functional tricuspid regurgitation, secondary to right ventricular changes
Pulmonary hypertension:
- Caused by elevated pulmonary venous pressure
- May lead to permanent vascular changes (increased pulmonary vascular resistance)
All patients with mitral stenosis should undergo pulmonary pressure estimation, including:
- Tricuspid regurgitation peak velocity
- Inferior vena cava (IVC) diameter
- IVC compliance with inspiration
Left Ventricular Function
In mitral stenosis:
- Left ventricular size and systolic function are typically normal
- Diastolic dysfunction is common due to impaired filling from restricted mitral flow
Quantifying mitral valve stenosis
Planimetry of the Mitral Valve
- Planimetry is a direct and reliable method for assessing mitral valve area (MVA), particularly useful when image quality is high.
- Best performed from the parasternal short-axis view, aiming to visualize the tips of the mitral leaflets.
- Technique:
- Carefully scan from apex to left atrium to find the smallest valve opening.
- Select the frame showing maximal valve opening in mid-diastole.
- Use the machine’s planimetry tool to trace the black/white interface between blood pool and leaflet tissue.
- The calculated valve area is automatically displayed.
Pulsed Wave Doppler Assessment
- Performed from the apical window, with sample volume placed at the valve leaflet tips.
- Measures diastolic transmitral velocities, including:
- Peak velocity
- Mean pressure gradient (more clinically relevant than peak)
- Velocity measurements are acquired by tracing the E-wave and A-wave envelope.
Pressure Half-Time (PHT)
- PHT = Time for pressure across the mitral valve to fall by 50% during diastole.
- Calculated by tracing the deceleration slope of the E-wave on spectral Doppler.
- Mitral Valve Area is then calculated using: MVA = 220 / PHT
- In atrial fibrillation, take the average of 5 cardiac cycles.
- Limitations:
- May overestimate MVA in severe aortic regurgitation
- May underestimate MVA in poor LV function
Continuity Equation Method
This method assumes conservation of mass, where the volume of blood across the mitral valve equals that across the LVOT:
Mitral Valve Area = (LVOT Area × LVOT VTI) / MV VTI
Step-by-step:
- LVOT Area:
- Measured from parasternal long-axis view.
- LVOT diameter is measured inner-edge to inner-edge during systole.
- Area = π × (diameter ÷ 2)² or simplified to: LVOT Area = (LVOT diameter² × 0.785)
- LVOT VTI:
- Obtain pulsed wave Doppler trace from apical 5-chamber view.
- Trace the velocity-time integral (VTI) of the waveform.
- Mitral Valve VTI:
- Obtain from pulsed wave Doppler at mitral valve tips in apical view.
- Trace the diastolic inflow waveform to get VTI.
Summary of Techniques
| Method | Key Strengths | Limitations |
|---|---|---|
| Planimetry | Direct visualization, accurate with good images | Limited by poor image quality, operator dependent |
| PHT | Quick, available in AF | Affected by AR and LV function |
| Continuity Equation | Uses flow data, avoids leaflet imaging issues | Complex, assumes no significant MR or AR |
This is an edited excerpt from the Medmastery course Echo Masterclass – The Valves by Chris Eggett, PhD. Acknowledgement and attribution to Medmastery for providing course transcripts.
Additional echocardiography resources:
- Na, M. Echo Masterclass: Left Ventricular Strain. Medmastery
- Monteiro, C. Echo Masterclass: The Right Heart. Medmastery
- West, C. Echo Masterclass: Adult Congenital Heart Disease. Medmastery
- Naderi, H. Echo Masterclass: The Power of 3D Imaging. Medmastery
Radiology Library: Echocardiography basics
- Eggett C. Echo basics: Valve Views. LITFL
- Eggett C. Echo basics: Valves, Measurements and Reports. LITFL
- Eggett C. Echo basics: Mitral valve. LITFL
- Eggett C. Echo basics: Mitral Regurgitation. LITFL
- Eggett C. Echo basics: Mitral Stenosis. LITFL
- Eggett C. Echo basics: Aortic Valve. LITFL
- Eggett C. Echo basics: Aortic Stenosis. LITFL
- Eggett C. Echo basics: Aortic Regurgitation. LITFL
- Eggett C. Echo basics: Tricuspid Valve. LITFL
- Eggett C. Echo basics: Pulmonary Valve. LITFL
- Eggett C. Echo basics: Prosthetic Valves. LITFL
Further reading
- Parker C, Rippey J. Ultrasound Case 110. LITFL
- Robbins A, Zhang G, Cadogan M. Eponymic Cardiac Murmurs. LITFL
- Otto CM. Textbook of Clinical Echocardiography. Elsevier. 7e, 2023.
- Houghton AR. Making Sense of Echocardiography: A Hands-on Guide. 3e 2023
- Otto CM, Nishimura RA, Bonow RO, Carabello BA, Erwin JP 3rd, Gentile F, Jneid H, Krieger EV, Mack M, McLeod C, O’Gara PT, Rigolin VH, Sundt TM 3rd, Thompson A, Toly C. 2020 ACC/AHA Guideline for the Management of Patients With Valvular Heart Disease: A Report of the American College of Cardiology/American Heart Association Joint Committee on Clinical Practice Guidelines. Circulation. 2021 Feb 2;143(5):e72-e227.
Echocardiography Essentials

Cardiac physiologist, echocardiographer, and Professor of Healthcare Science Education, Faculty of Medical Sciences at the University of Newcastle, UK. I direct post-grad programs at the Faculty of Medical Sciences, run an echo clinic at the Freeman Hospital, and teach transthoracic echocardiography to specialists in critical and emergency care and anaesthetic settings