
![]()
Lewis lead
Description
The Lewis lead configuration (S5-lead placement) is used to better detect atrial activity in relation to that of the ventricles.
P waves (reflecting atrial activity) are usually much less apparent than ventricular activity. The Lewis lead can be of value in amplifying these waves, allowing:
- visualisation of flutter waves in atrial flutter;
- clarifying the mechanism of an atrial arrhythmia;
- detecting P waves in wide complex tachyarrhythmias to identify atrioventricular dissociation
- detect the type of ventriculoatrial conduction during ventricular pacing
Named after Welsh cardiologist Sir Thomas Lewis (1881-1945), Lewis developed and described (1913) his lead configuration to magnify atrial oscillations present during atrial fibrillation.
Lewis lead placement
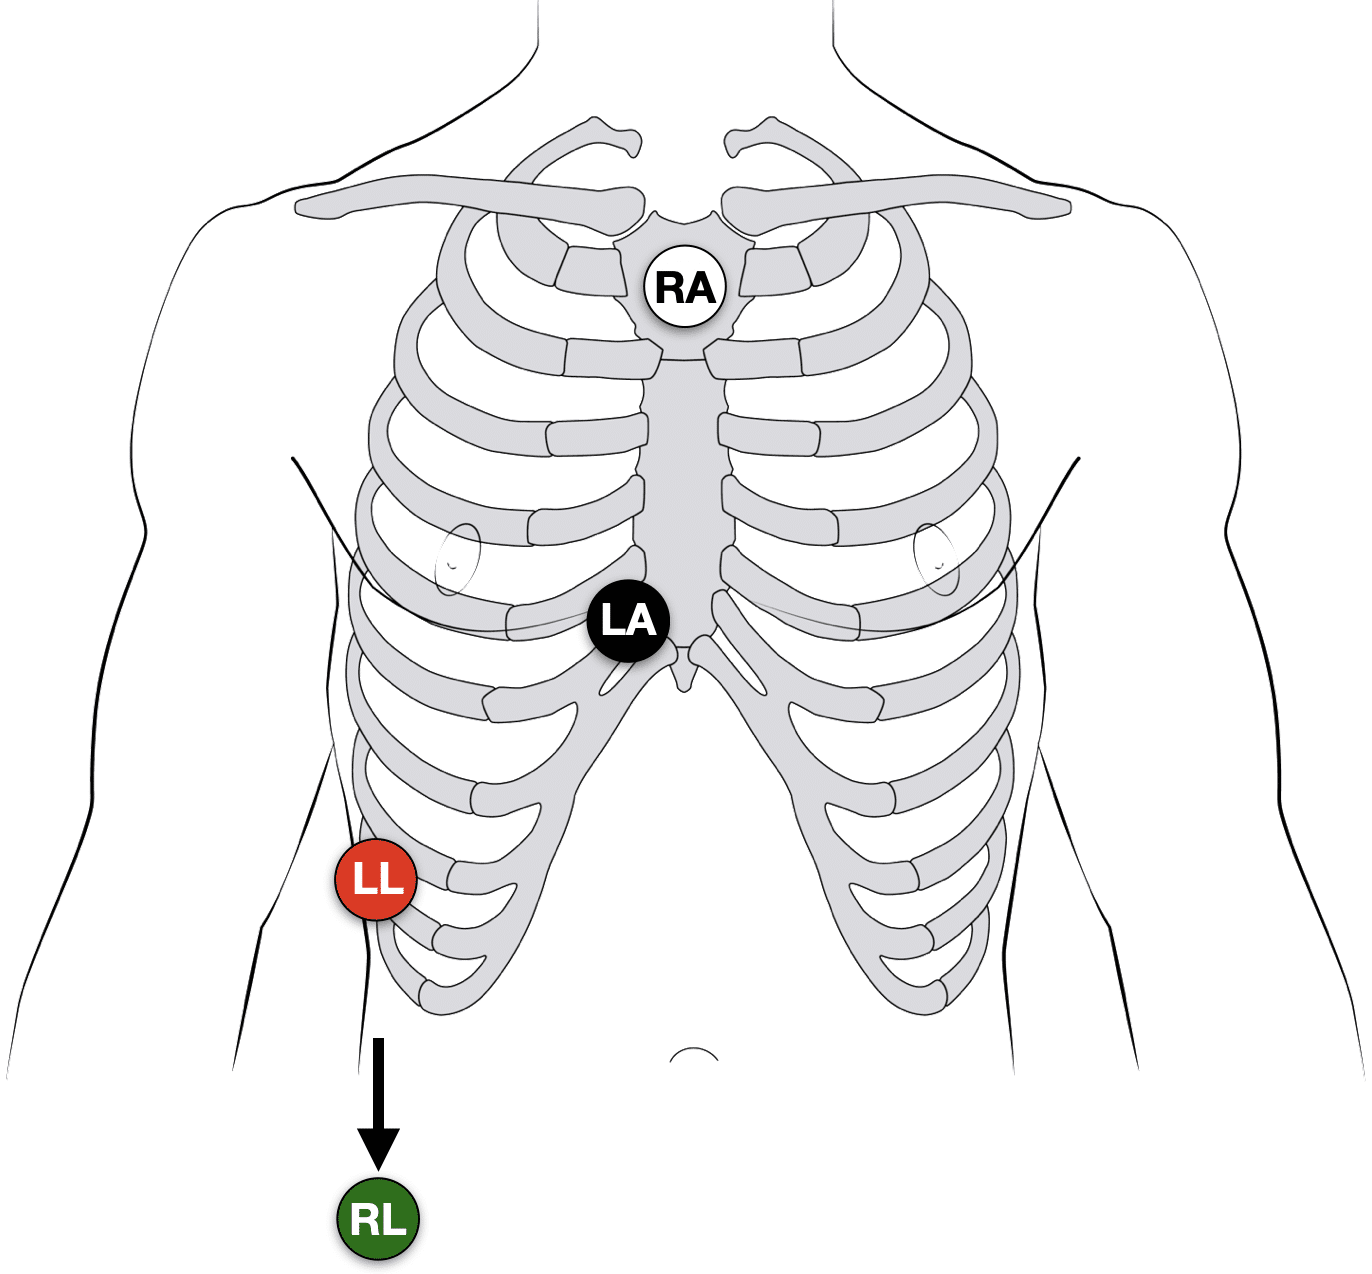
There are multiple described patterns of Lewis lead placement. In our experience the best way to ‘reveal’ and increase the amplitude of hidden P waves is to move the RA, LA and LL leads, and monitor lead I or II:
- Right Arm (RA) electrode on manubrium
- Left Arm (LA) electrode over 5th ICS, right sternal border.
- Left Leg (LL) electrode over right lower costal margin.
- Right Leg (RL) electrode in standard position on right leg
- Monitor Lead I or II
Note: Increasing calibration from 10 to 20mm/mV; and paper speed from 25 to 50mm/second can further amplify the atrial activity.

Alternate lead positions
The original Lewis description has been modified in various texts and published papers. Alternate placements based on interpretation of the original diagram exist. The most common (as well as simple and rapid to employ) is to change the RA and LA lead only, and monitor lead I:
- Right Arm (RA) electrode to the right of the sternum at the second intercostal space
- Left Arm (LA) electrode over 4th ICS just to the right of the sternal border
- Monitor Lead I

The right arm electrode is placed in the second intercostal space to the right of the sternum. The left arm electrode is placed in the fourth intercostal space to the right of the sternum. The tracing is then recorded on lead I.
Goldman MJ. Principles of Clinical Electrocardiography 11e. 1982
Clinical examples
Example 1
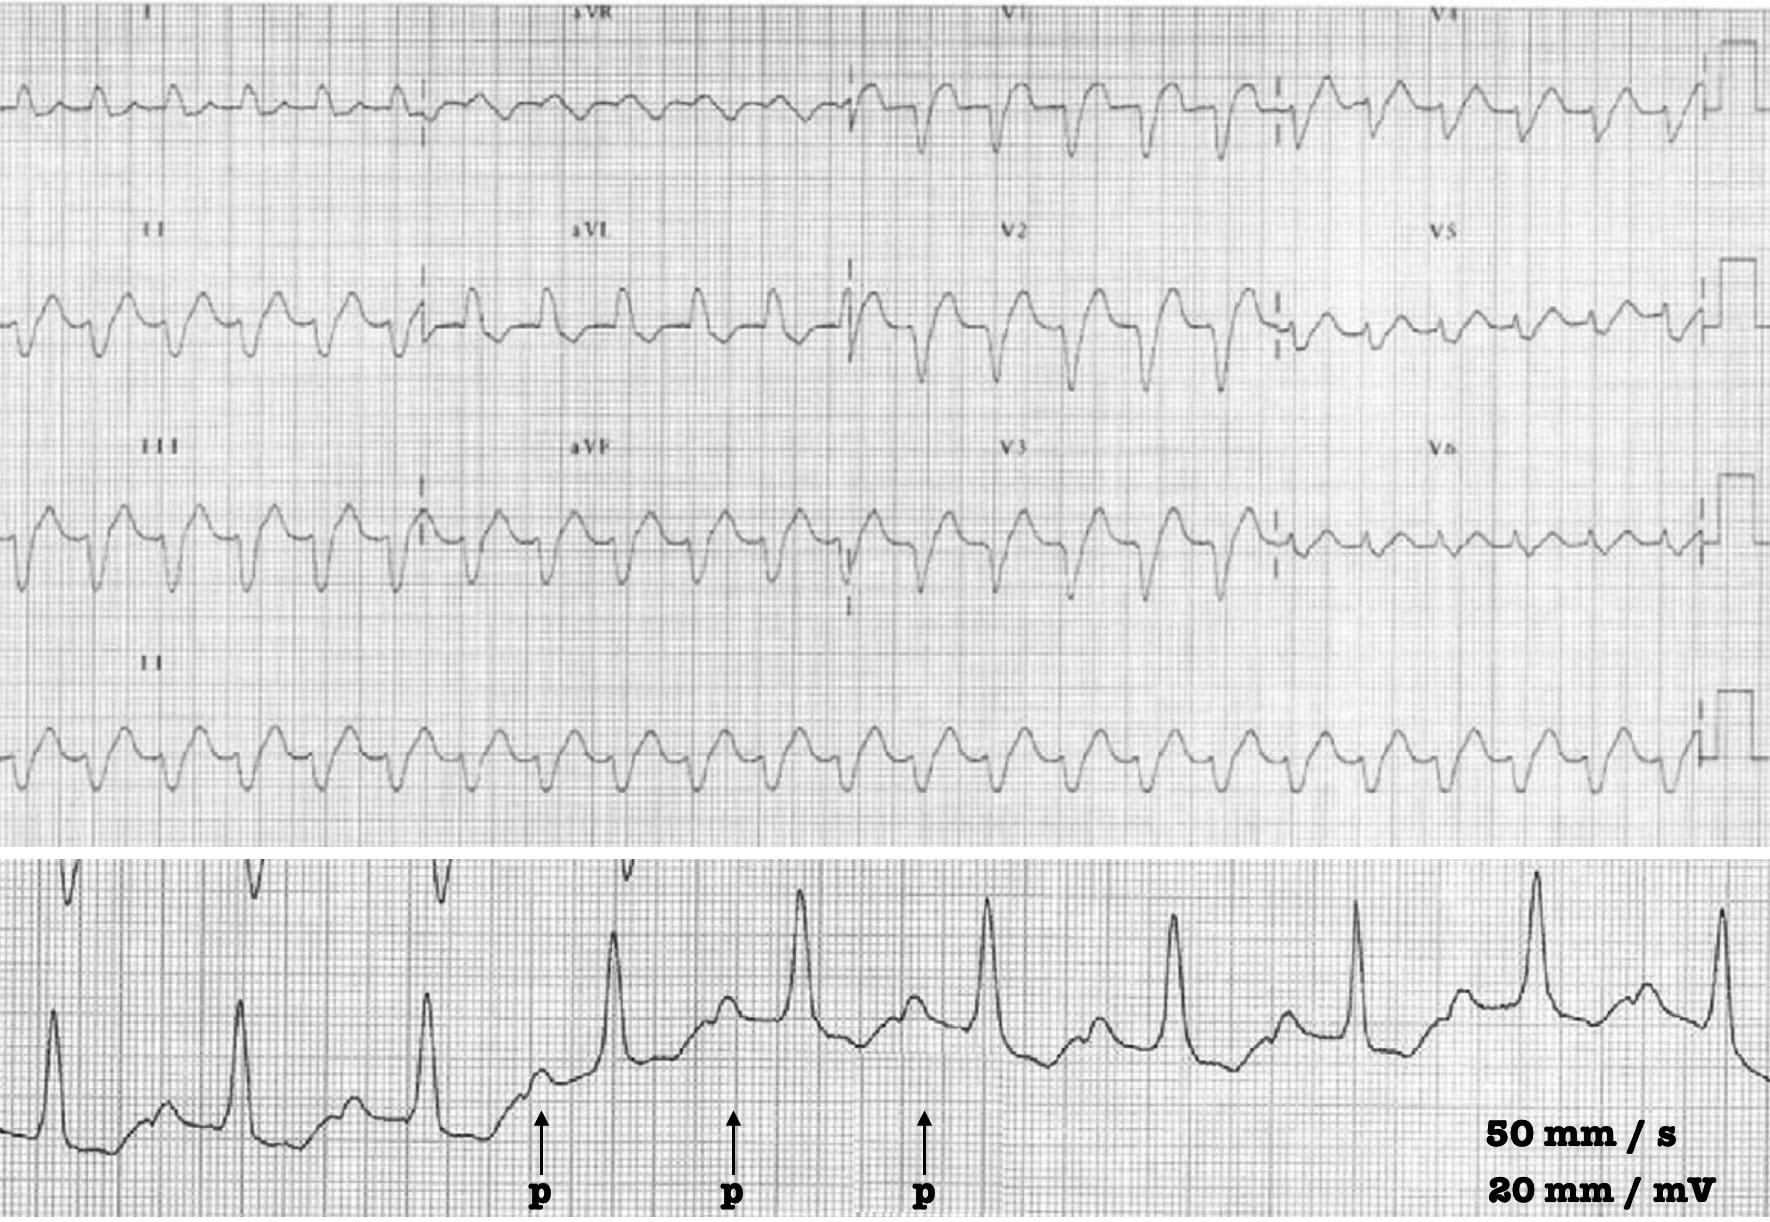
12-lead ECG: showing a wide QRS tachycardia.
Lead I strip: Lewis lead obtained with a paper speed of 50 mm/s and twice normal calibration at 20mm/mV. Regular P waves can now be clearly identified.
Example 2

12 lead ECG: showing a regular broad complex tachycardia of 120 bpm.
Lead I strip: Lewis lead configuration amplifies the P waves in the lead I strip. Atrioventricular dissociation is revealed, confirming the diagnosis of ventricular tachycardia (VT).
History of the Lewis lead
Sir Thomas Lewis (1881-1945) developed and described (1913) his lead configuration to magnify atrial oscillations present during atrial fibrillation.
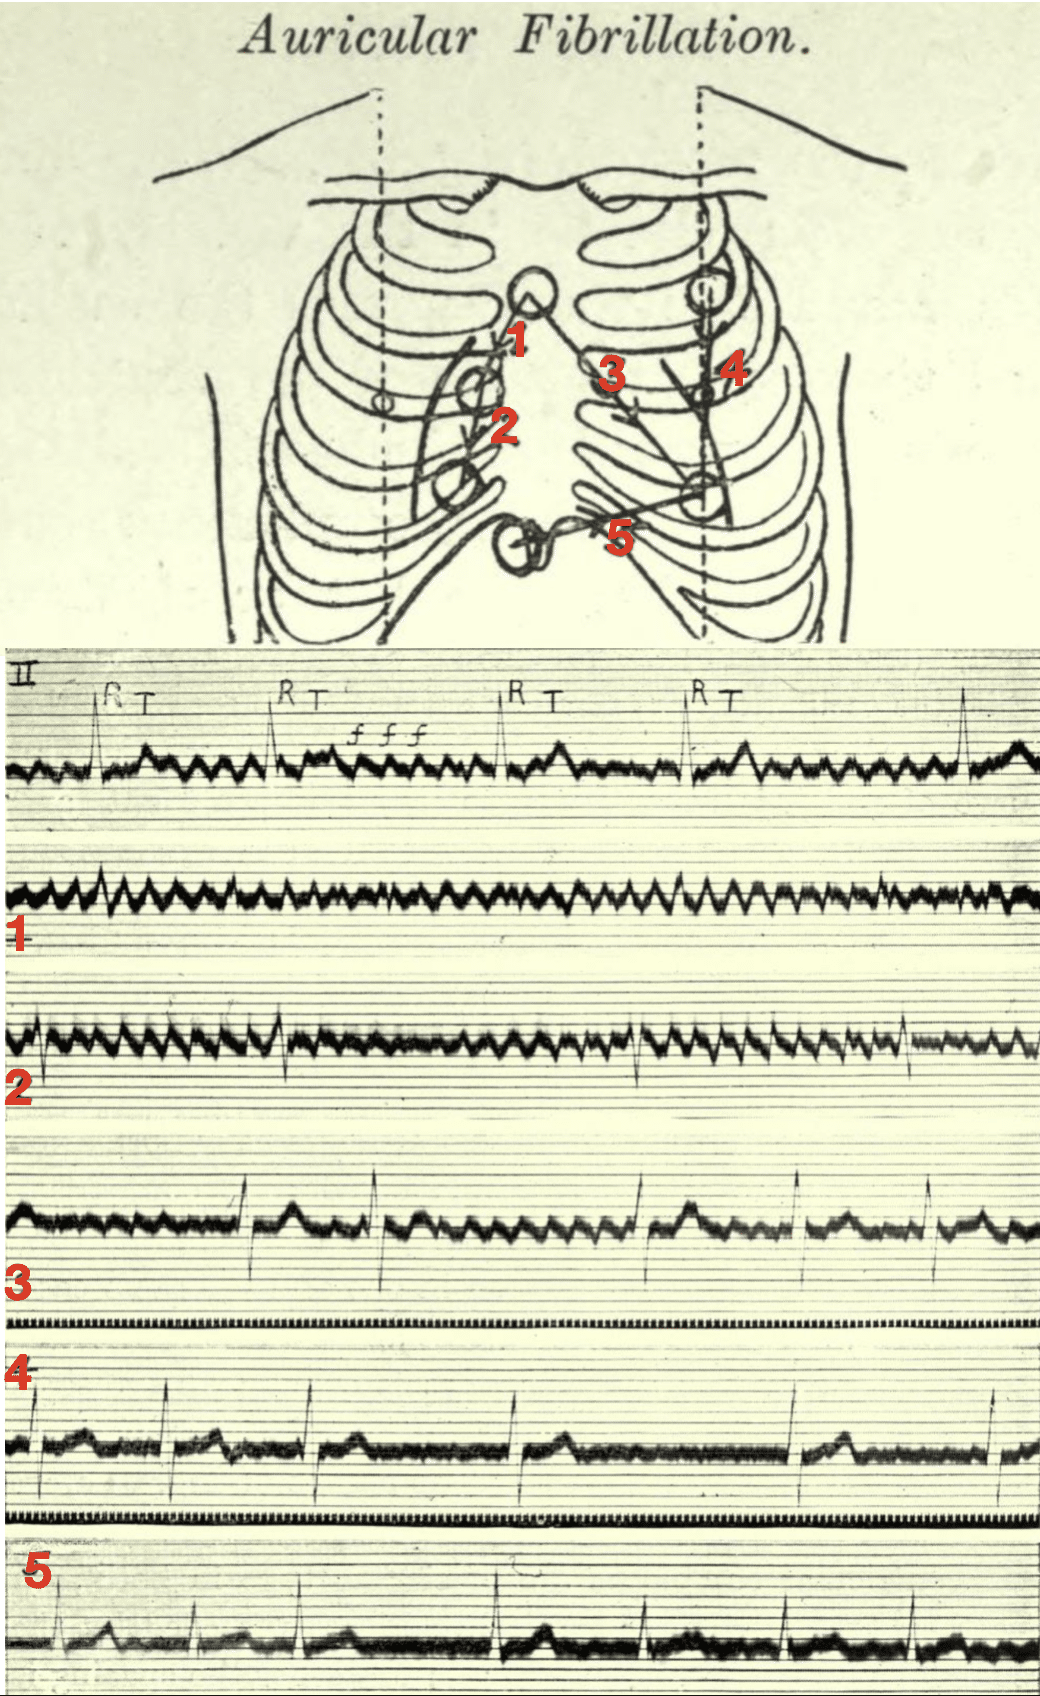
When fibrillation is present and the electrodes lie in the vicinity of the right auricle (leads 1 and 2 of the diagram), the oscillations are maximal, and there is but a trace of the ventricular beats. When they lie in the long axis of the heart (lead 3), both the oscillations and the ventricular complexes are conspicuous. Finally, when they lie along the left or right ventricular border (leads 4 and 5), the ventricular complexes are clear cut while the oscillations are small or absent.
The corresponding electrocardiograms are shown below the diagram, the first curve of which is from the customary lead II (right arm to left leg). The oscillations of fibrillation are readily identified in this manner and their origin in the auricle is clearly indicated. In tremulous subjects, no oscillations are seen in any of the special leads.
Lewis 1913
Lewis T. Auricular fibrillation 1913
The first electrocardiogram is from lead II; it consists of irregularly placed ventricular complexes (R, T) and of large and continuous oscillations (f f).
The remaining five curves are from the chest wall:
- 1 and 2 were taken from the area overlying the right auricle — in these leads the oscillations are maximal and the ventricular complexes are minimal
- 3 was taken from an oblique lead covering the whole heart, and it shows both oscillations and ventricular complexes.
- 4 and 5 were taken from leads along the margins of the ventricles — they show but little sign of the oscillations
References
Original articles
- Lewis T. Auricular fibrillation. In: Clinical Electrocardiography. 1913: 86-97
- Goldman MJ. Bipolar chest leads. In: Principles of Clinical Electrocardiography 11e. 1982
Lewis lead in clinical practice
- Bakker AL et al. The Lewis lead: making recognition of P waves easy during wide QRS complex tachycardia. Circulation. 2009 Jun 23;119(24):e592-3
- Rodrigues de Holanda-Miranda W, Furtado FM, Luciano PM, Pazin-Filho A. Lewis lead enhances atrial activity detection in wide QRS tachycardia. J Emerg Med. 2012 Aug;43(2):e97-9
- Mizuno A, Masuda K, Niwa K. Usefulness of lewis lead for visualizing p-wave. Circ J. 2014;78(11):2774-5.
- Aksu U, Kalkan K, Gülcü O, Topcu S, Sevimli S, Aksakal E, Ipek E, Açıkel M, Tanboğa IH. Comparison of standard and Lewis ECG in detection of atrioventricular dissociation in patients with wide QRS tachycardia. Int J Cardiol. 2016 Dec 15;225:4-8
- Huemer M, Meloh H, Attanasio P, Wutzler A, Parwani AS, Matsuda H, Blaschke F, Boldt LH, Haverkamp W. The Lewis Lead for Detection of Ventriculoatrial Conduction Type. Clin Cardiol. 2016 Feb;39(2):126-31.
Further reading
- Wiesbauer F. Atrial Fibrillation Management Essentials. Medmastery
- Connelly K. Diagnostics: Alternative EKG Leads Taming the SRU 2019
- Buttner R. Lewis Lead. Eponym A Day. Instagram
- ECG Library. ECG Lead positioning
Clinical cases (Dr Smith’s ECG blog)
- Smith S. Wide Complex Tachycardia. What is the Diagnosis?. 2012
- Smith S. Wide Complex Tachycardia: Lewis Leads Do Not Differentiate VT from SVT with Aberrancy. 2014
- Smith S. A Very Wide Complex Tachycardia. What is the Rhythm? Use Lewis Leads!! 2014
- Smith S. Atrial fibrillation with RVR: use POCUS to assess volume; then sinus vs. SVT: use of Lewis leads. 2017
- Smith S. A fast narrow complex rhythm. 2017
- Smith S. Hypotensive and Tachycardic in Clinic: A Quick Ticket to the ED and Lewis Leads. 2018
- Smith S. Regular, steady, and fast at 170 (wide or narrow?), hypoxic, crackles in lungs, B-lines, unconscious. 2019
eponymictionary
the names behind the name

MBBS FACEM DDU (Emergency) CCPU. Emergency Physician in Melbourne, Australia. Co-Ultrasound Lead for Emergency Medicine at The Alfred Hospital. Special interests in diagnostic and procedural ultrasound, medical education, and ECG interpretation. Editor of the LITFL ECG Library.
BA MA (Oxon) MBChB (Edin) FACEM FFSEM. Emergency physician, Sir Charles Gairdner Hospital. Passion for rugby; medical history; medical education; and asynchronous learning #FOAMed evangelist. Co-founder and CTO of Life in the Fast lane | On Call: Principles and Protocol 4e| Eponyms | Books |

Great website to look things up.
It is pure gold. Thanks!