![]()
Fontaine lead
Description
Fontaine bipolar precordial leads (F-ECG) are used to increase the sensitivity of epsilon wave detection, characteristic of arrhythmogenic right ventricular dysplasia (ARVD/C)
Epsilon waves are the most specific and characteristic finding in ARVD caused by post-excitation of myocytes in the right ventricle. They are seen as a small deflections (“blip” or “wiggle”) buried in the end, or immediately following the QRS complex.
The term “epsilon” was nice, because it occurs in the Greek alphabet after delta; thus, delta represents the pre-excitation and epsilon the post-excitation phenomenon. In addition, epsilon is also used in mathematics to express a very small phenomenon…
Fontaine 1997
Epsilon waves can be detected by:
- S-ECG: Standard 12-lead electrocardiography (S-ECG)
- R-ECG; Right-sided precordial lead electrocardiography (R-ECG)
- F-ECG; Fontaine bipolar precordial lead electrocardiography (F-ECG)
On the standard 12-lead ECG (S-ECG) they are usually present in unipolar leads V1 through V4, and best seen in the ST segment of V1 and V2.
In 30% of cases, specific changes may be recorded, such as ventricular post-excitation waves. These are potentials of small amplitude that have been called the Epsilon waves. They occur after the QRS complex at the beginning of the ST segment and reflect on the surface ECG the presence of delayed activation of some right ventricular fibers.
Fontaine 1999
Guy Hugues Fontaine (1936-2018) was a French cardiologist and electrophysiologist. He provided the name for ARVD; the epsilon wave; and the Fontaine lead placement to best amplify the waves on an ECG
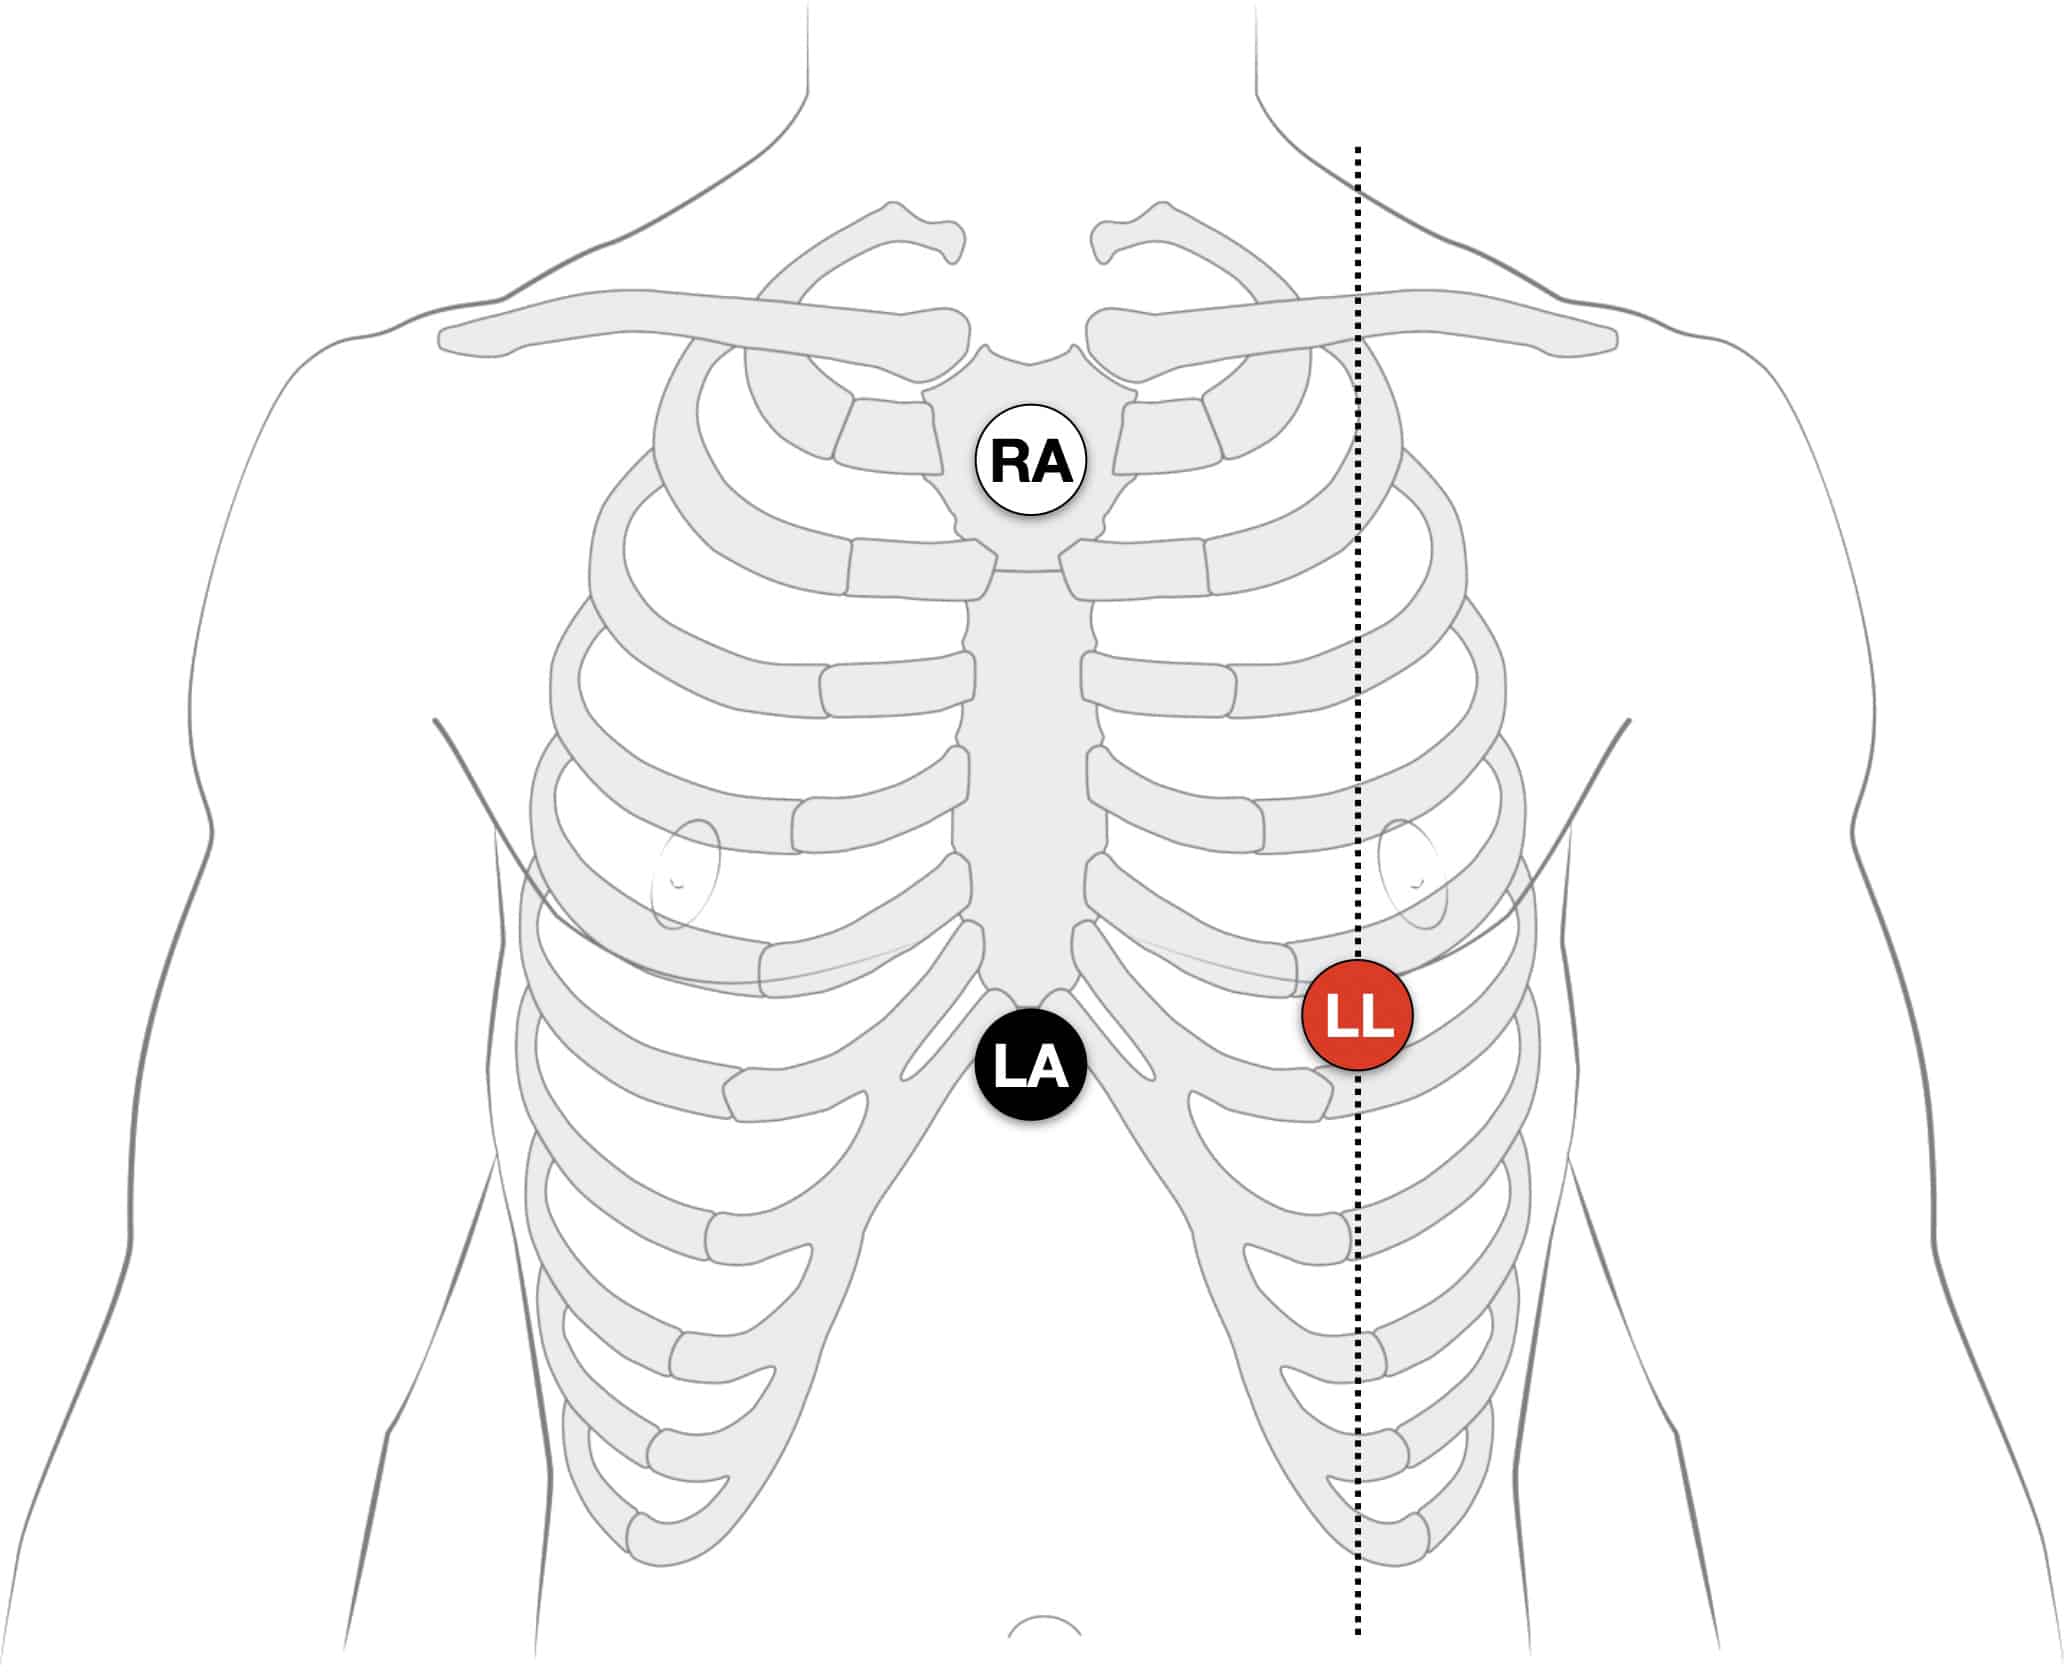
Fontaine lead placement
Fontaine bipolar precordial leads (F-ECG) can be used to increase the sensitivity of epsilon wave detection in ARVD. For example, Peters et al detected epsilon waves in 23% of their study sample by S-ECG and in 75% by F-ECG.
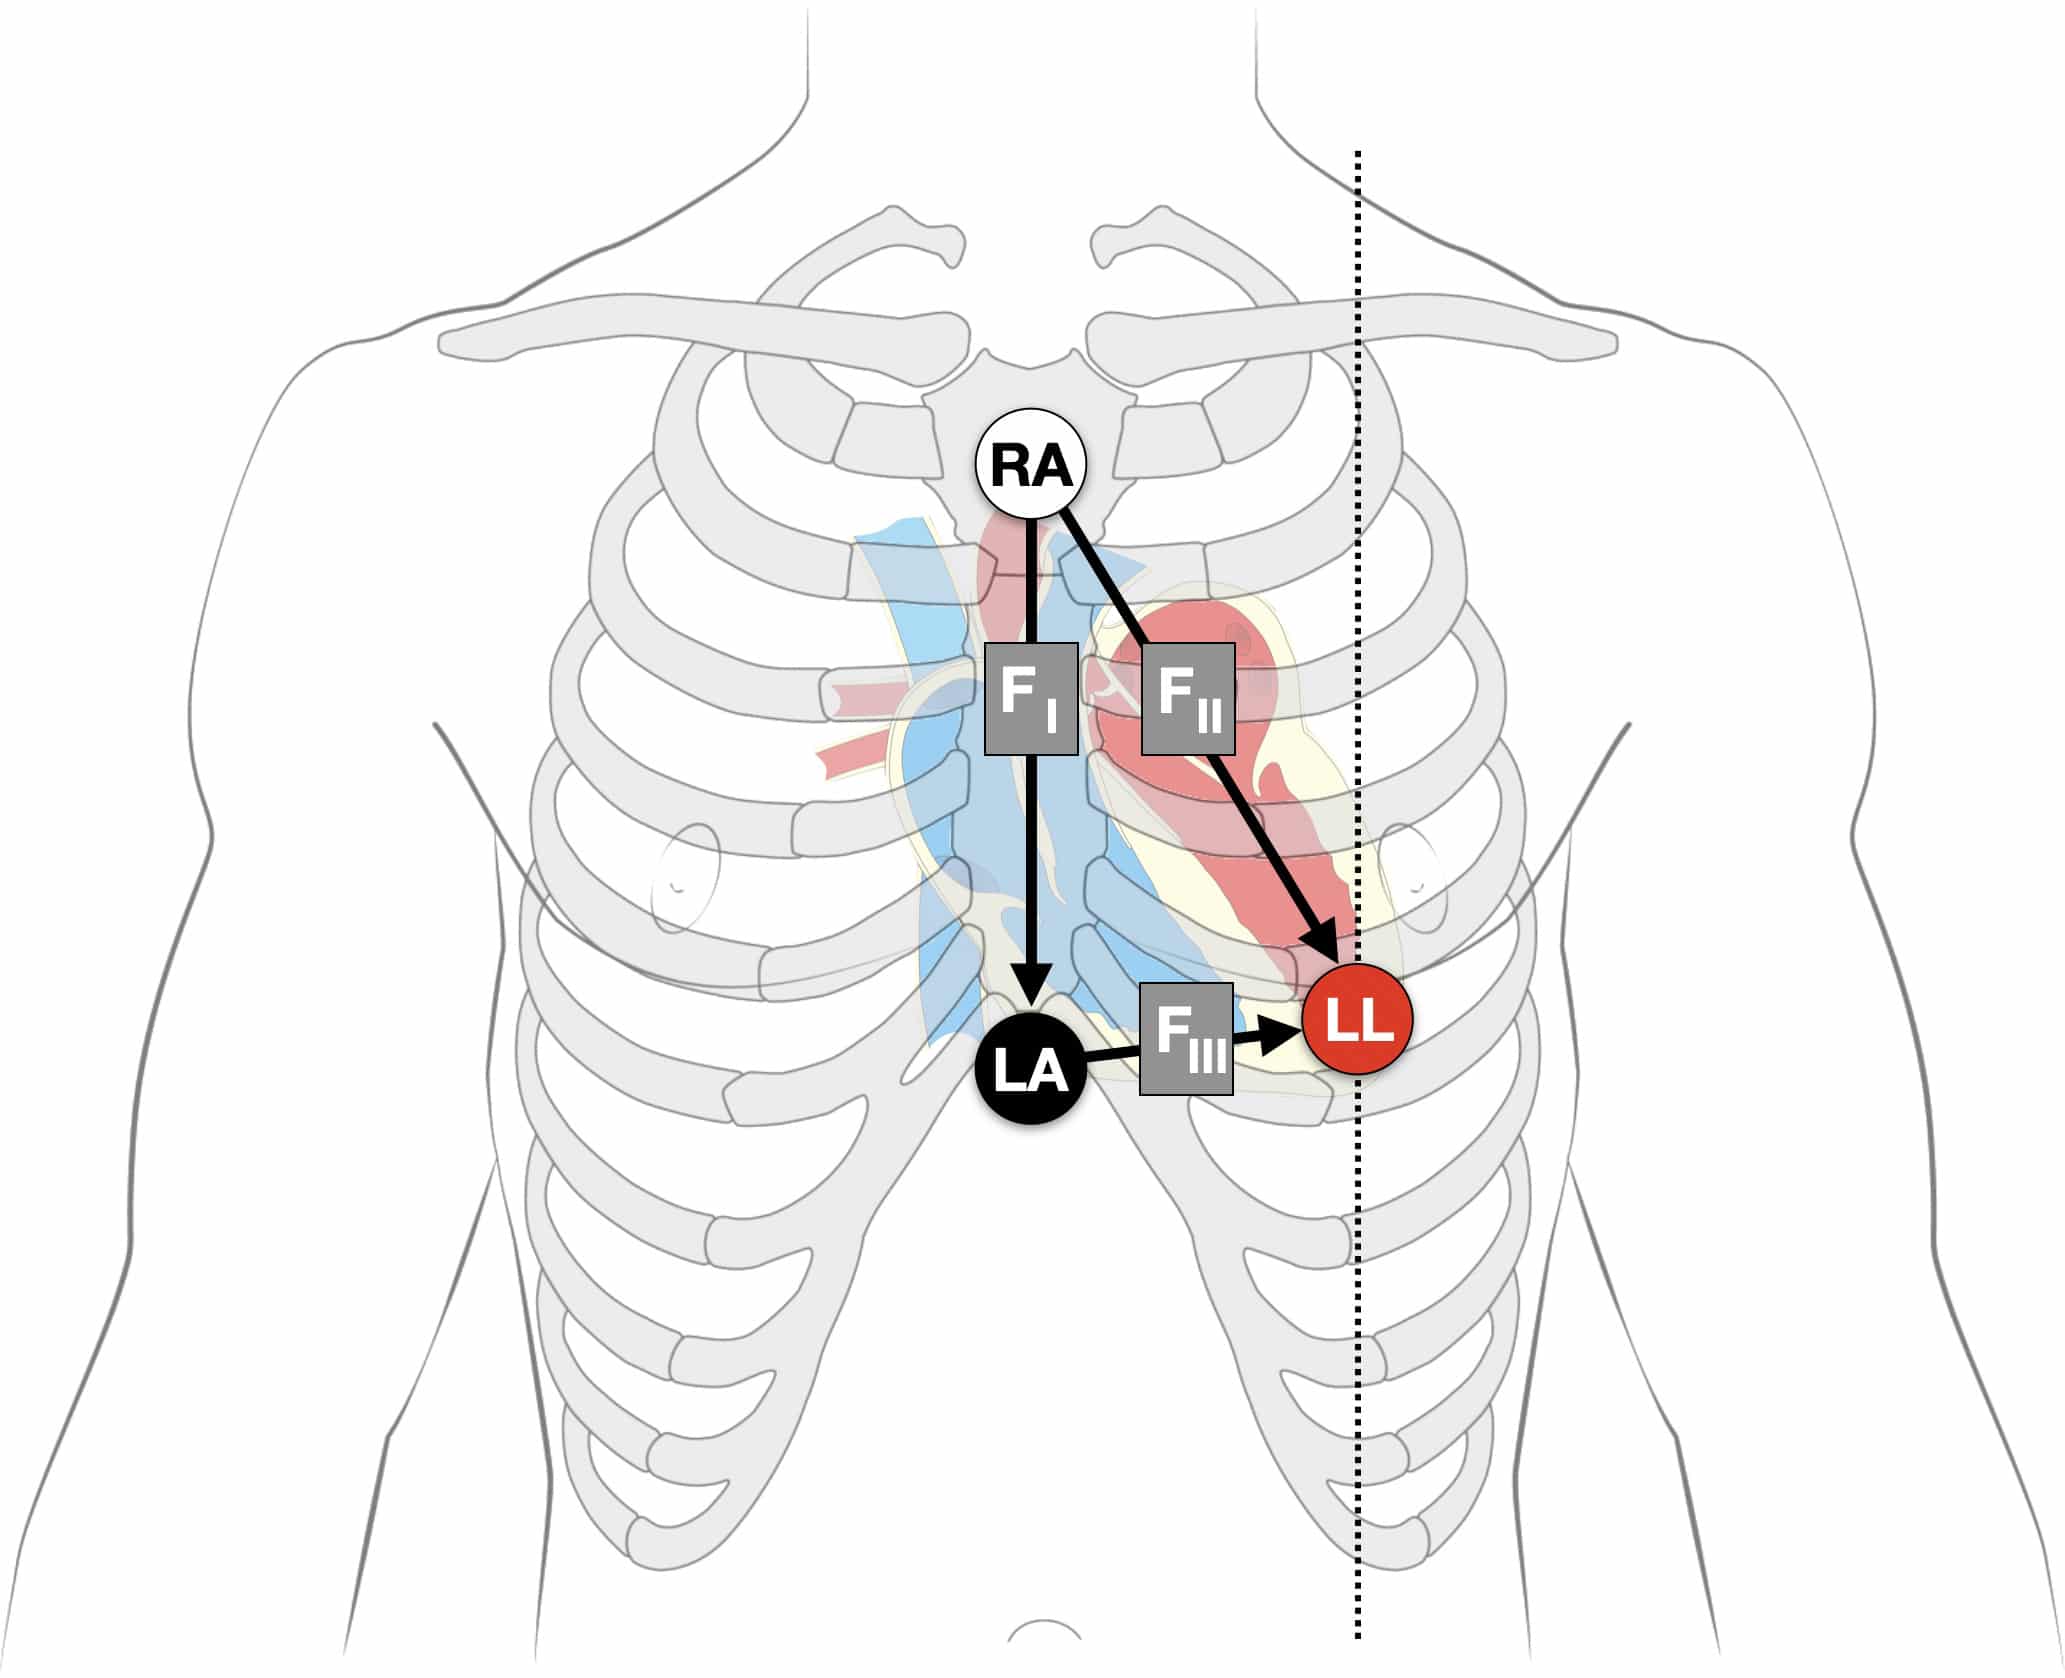
Instead of regular leads I, II, and III there are now three bipolar chest leads that are termed FI, FII, and FIII which record the potentials developed in the right ventricle, from the infundibulum to the diaphragm.
- Right Arm (RA) electrode on the manubrium;
- Left Arm (LA) electrode over the xiphoid process;
- Left Leg (LL) electrode in the standard V4 position (5th ICS MCL).
- Creating F-ECG with FI, FII, FIII leads
Note: Increasing calibration from 10 to 20mm/mV; and paper speed from 25 to 50mm/second can further amplify the atrial activity.
Lead naming
Classically, the diagrams showing the Fontaine vector triangle demonstrate FII as LA to LL and with FII from RA to LL. However, we feel the diagram is more accurately represented as above, based on Fontaine’s original description:
- Fontaine Lead I: RA (-) to LA (+)
- Fontaine Lead II: RA (-) to LL (+)
- Fontaine Lead III: LA (-) to LL (+)
[Epsilon] waves are better demonstrated by placement of a suction electrode connected to the right arm connection (negative) on the manubrium sternum and the left arm connection (positive) on the xyphoid. This produces a first (FI) bipolar chest lead. In addition, the placement of the foot lead (positive) in position V4 provides three bipolar chest leads (FI, FII, FIII) instead of regular leads (I, II, III). This arrangement is used to record more specifically the potentials developed by the delayed right ventricular fibers, covering the infundibulum, the apex, and the diaphragmatic aspect of the right ventricle.
Fontaine 1999
The vertical bipolar lead FI, which is similar to VF, seems to be the most appropriate to record epsilon waves; it also magnifies the atrial potentials. It could be useful in the search for AV dissociation in ventricular tachycardia or to study abnormal atrial rhythms when the P waves are too small on regular leads.
Fontaine to Hurst, Circulation 1998
Clinical studies
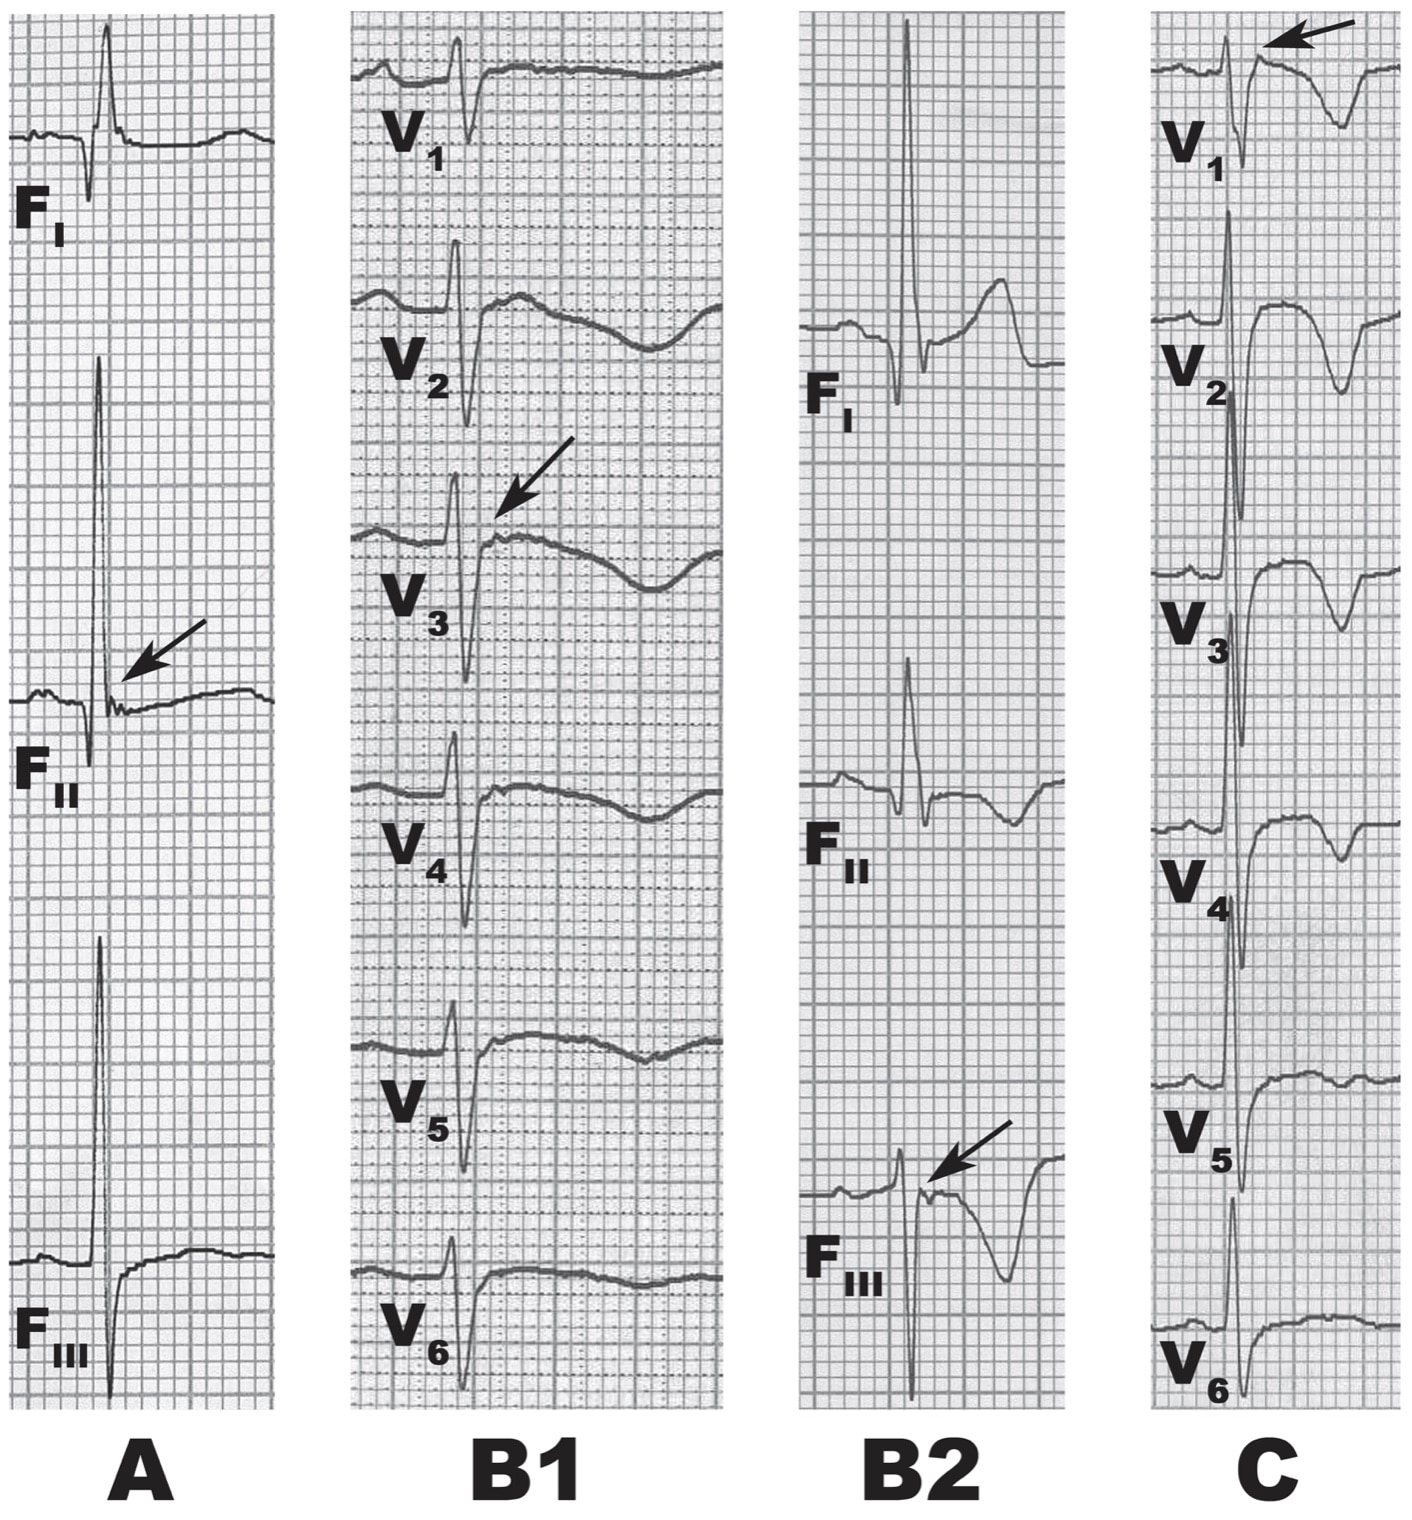
In 2010, Wang et al published their study on Epsilon waves detected by various electrocardiographic recording methods: in patients with arrhythmogenic right ventricular cardiomyopathy. In particular they compared the three ECG methods of S-ECG, R-ECG and F-ECG in known ARVD/C patients.
They identified 3 patterns of epsilon waves:
- (A) wiggle waves
- (B) small spike waves [B1 – spike upward; B2 – spike downward]
- (C) smooth potential waves with the QRS duration in V1 exceeding the QRS duration in V3 by at least 25ms.
They found that
- The duration and amplitude of epsilon waves detected by F-ECG were longer and larger than those detected by the other 2 ECG recording methods.
- Epsilon waves are relatively low in sensitivity, manifesting themselves during S-ECG in only 20% to 25% of ARVC patients; and those waves are usually seen in leads V1 through V3.
- Epsilon waves were found in 38% of all patients using S-ECG and increased that to 50% by using F-ECG.
- The detection rate of epsilon waves using combined methods of ECG recording was significantly higher than that of S-ECG alone (S-ECG 38%; SF-ECG 56%; and SRF-ECG 66%, P=0.0039).
Clinical examples
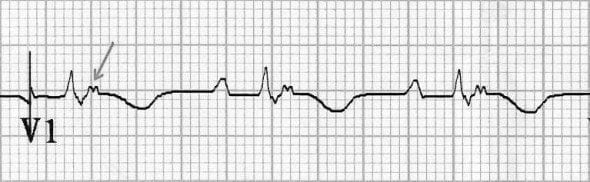
Example 1
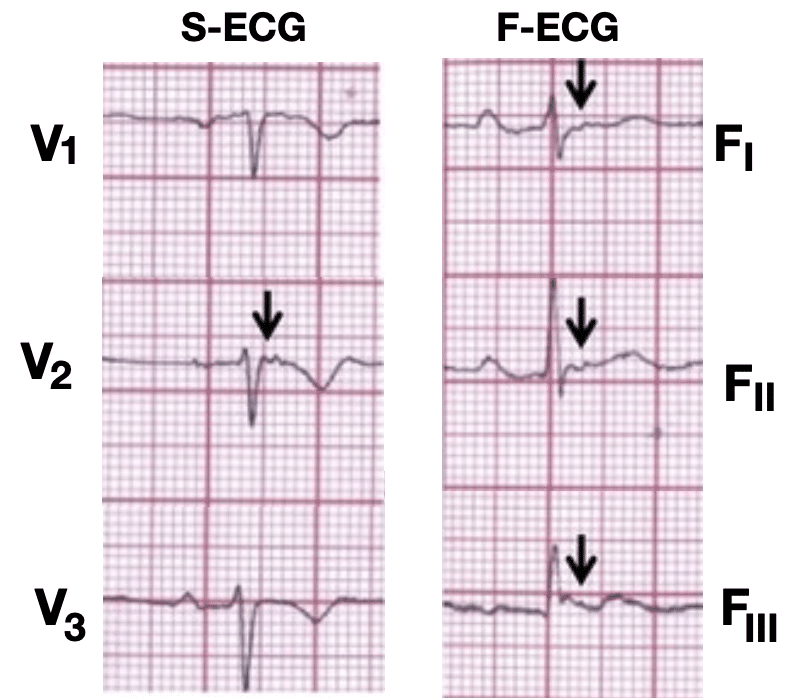
The Fontaine lead placement increases sensitivity of detecting epsilon waves so that they are detected in three leads (FI, FII, FIII) rather than one lead in the regular placement.
Example 2
26 year old male presents to emergency with palpitations, dizziness and diaphoresis., No complaints of chest pain or shortness of breath.
ECG on arrival:
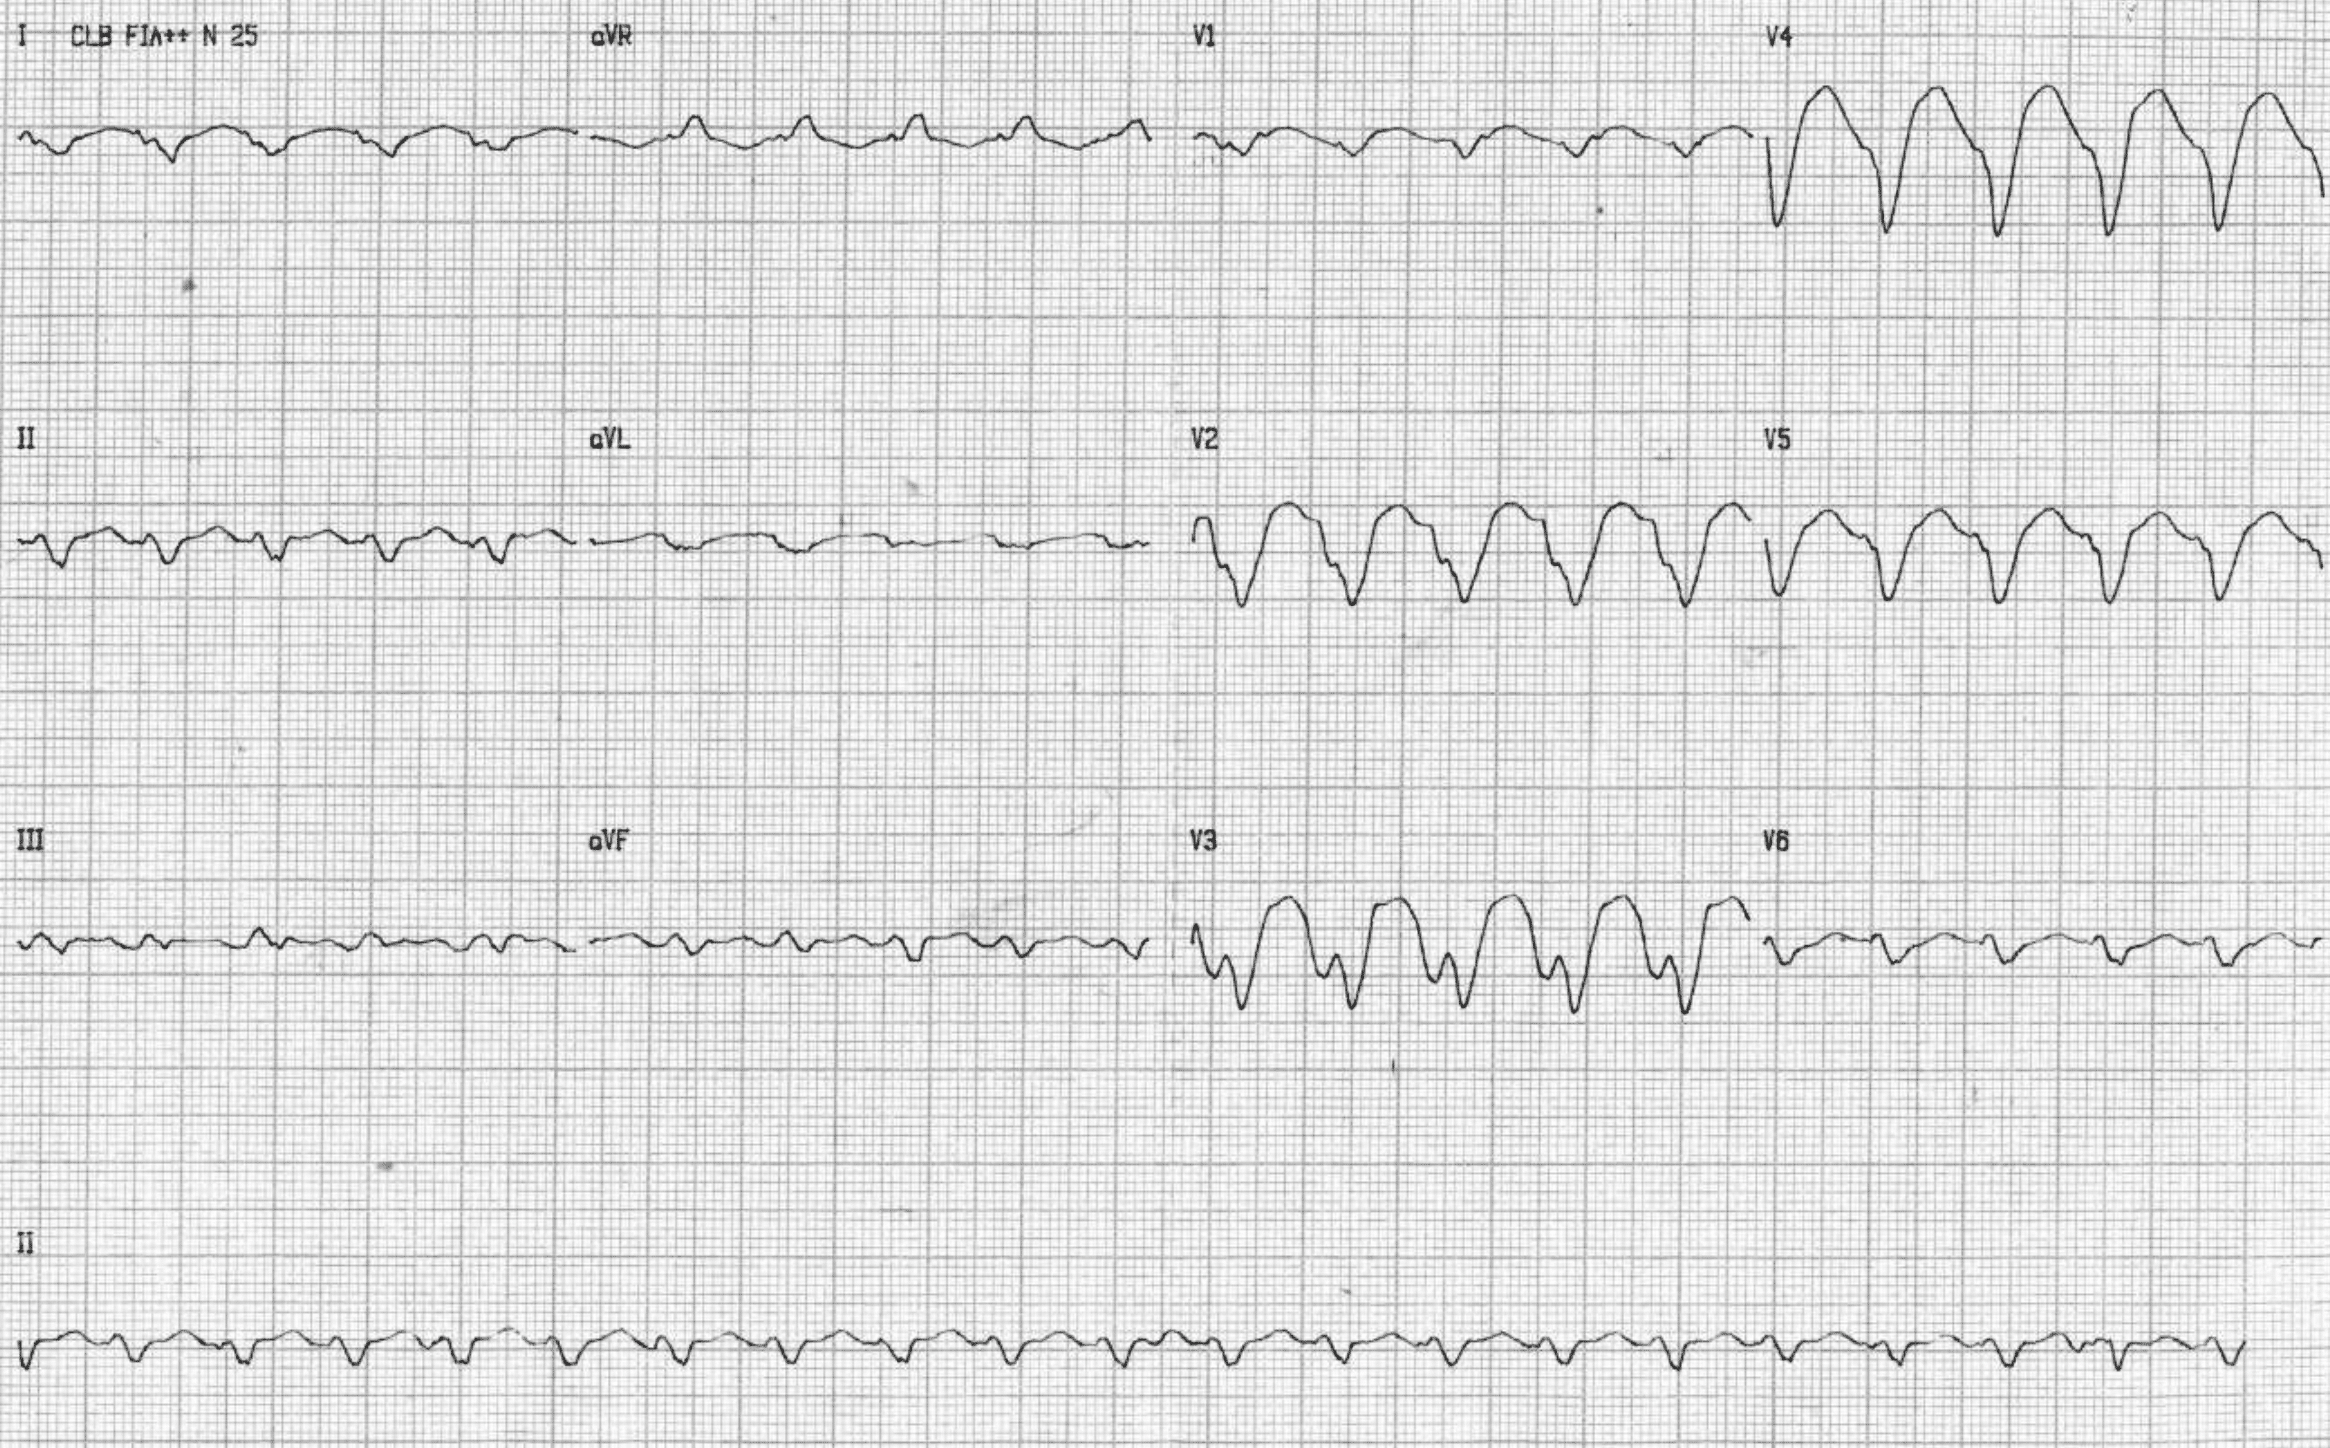
ECG diagnosis: sustained VT with LBBB pattern, heart rate = 125 bpm and right superior QRS axis (only aVR lead with positive QRS complexes). This atypical axis is a hallmark of VT with focus in apex of right ventricle.
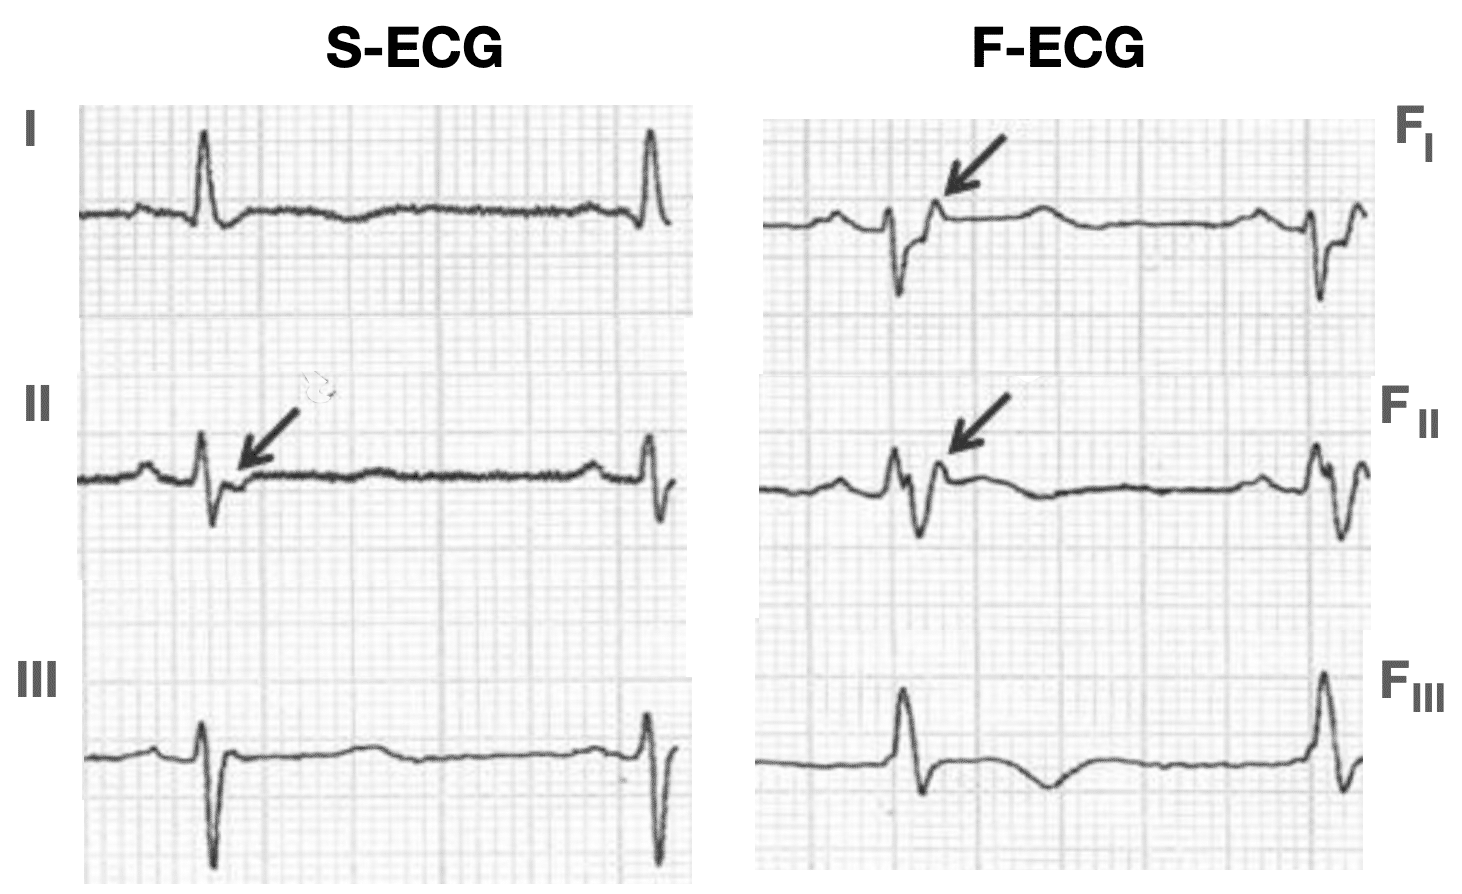
ECG Post cardioversion

Universal low voltage of QRS complexes. Epsilon wave V2 and lead II. T wave inversion in all precordial leads
F-ECG
Pérez-Riera AR. 2019
References
Original articles
- Fontaine G et al. Stimulation studies and epicardial mapping in ventricular tachycardia: study of mechanisms and selection for surgery. In: Kulbertus HE, ed. Re-entrant Arrhythmias: Mechanisms and Treatment. 1977: 334 –350
- Fontaine G. Arrhythmogenic right ventricular dysplasia. Curr Opin Cardiol. 1995 Jan;10(1):16-20.
- Marcus FI, Fontaine G. Arrhythmogenic right ventricular dysplasia/cardiomyopathy: a review. Pacing Clin Electrophysiol. 1995 Jun;18(6):1298-314
- Fontaine G, Fontaliran F, Frank R. Arrhythmogenic right ventricular cardiomyopathies: clinical forms and main differential diagnoses. Circulation. 1998 Apr 28;97(16):1532-5
- Fontaine G, Fontaliran F, Hébert JL, Chemla D, Zenati O, Lecarpentier Y, Frank R. Arrhythmogenic right ventricular dysplasia. Annu Rev Med. 1999;50:17-35
Fontaine lead in clinical practice
- Peters S, Trümmel M. Diagnosis of arrhythmogenic right ventricular dysplasia-cardiomyopathy: value of standard ECG revisited. Ann Noninvasive Electrocardiol. 2003 Jul;8(3):238-45
- Wang J, Yang B, Chen H, Ju W, Chen K, Zhang F, Cao K, Chen M. Epsilon waves detected by various electrocardiographic recording methods: in patients with arrhythmogenic right ventricular cardiomyopathy. Tex Heart Inst J. 2010; 37(4): 405-11.
- Gottschalk B, Gysel M, Barbosa-Barros R, De Sousa Rocha RP, Pérez-Riera AR, Zhang L, Fontaine G, Baranchuk A. The use of fontaine leads in the diagnosis of arrhythmogenic right ventricular dysplasia. Ann Noninvasive Electrocardiol. 2014 May;19(3):279-84.
- Moreira D, Delgado A, Marmelo B, Correia E, Gama P, Pipa J, Nunes L, Santos O. Arrhythmogenic right ventricular cardiomyopathy: contribution of different electrocardiographic techniques. Rev Port Cardiol. 2014 Apr;33(4):243.e1-7.
- Pérez-Riera AR, Barbosa-Barros R, Daminello-Raimundo R, de Abreu LC, García-Niebla J, de Deus Morais MJ, Nikus K, Marcus FI. Epsilon wave: A review of historical aspects. Indian Pacing Electrophysiol J. 2019 Mar-Apr;19(2):63-67.
Further reading
- Hurst JW. Naming of the waves in the ECG, with a brief account of their genesis. Circulation. 1998 Nov 3;98(18):1937-42.
- Buttner R. Fontaine Leads. Eponym a Day. Instagram
- ECG Library. ECG Lead positioning
eponymictionary
the names behind the name

MBBS FACEM DDU (Emergency) CCPU. Emergency Physician in Melbourne, Australia. Co-Ultrasound Lead for Emergency Medicine at The Alfred Hospital. Special interests in diagnostic and procedural ultrasound, medical education, and ECG interpretation. Co-creator of the LITFL ECG Library. Twitter: @rob_buttner
BA MA (Oxon) MBChB (Edin) FACEM FFSEM. Emergency physician, Sir Charles Gairdner Hospital. Passion for rugby; medical history; medical education; and asynchronous learning #FOAMed evangelist. Co-founder and CTO of Life in the Fast lane | On Call: Principles and Protocol 4e| Eponyms | Books |