![]()
Abdominal CT: Attenuation
Measuring attenuation
The density of a structure determines how well it blocks x-rays from reaching the detector, which determines its appearance on CT. Dense structures like bone or contrast block more x-rays and appear bright, whereas structures like air and fat appear darker, even black, because they do not block as many x-rays.
We can use attenuation to interrogate CT images for fluid, masses and fatty infiltration.
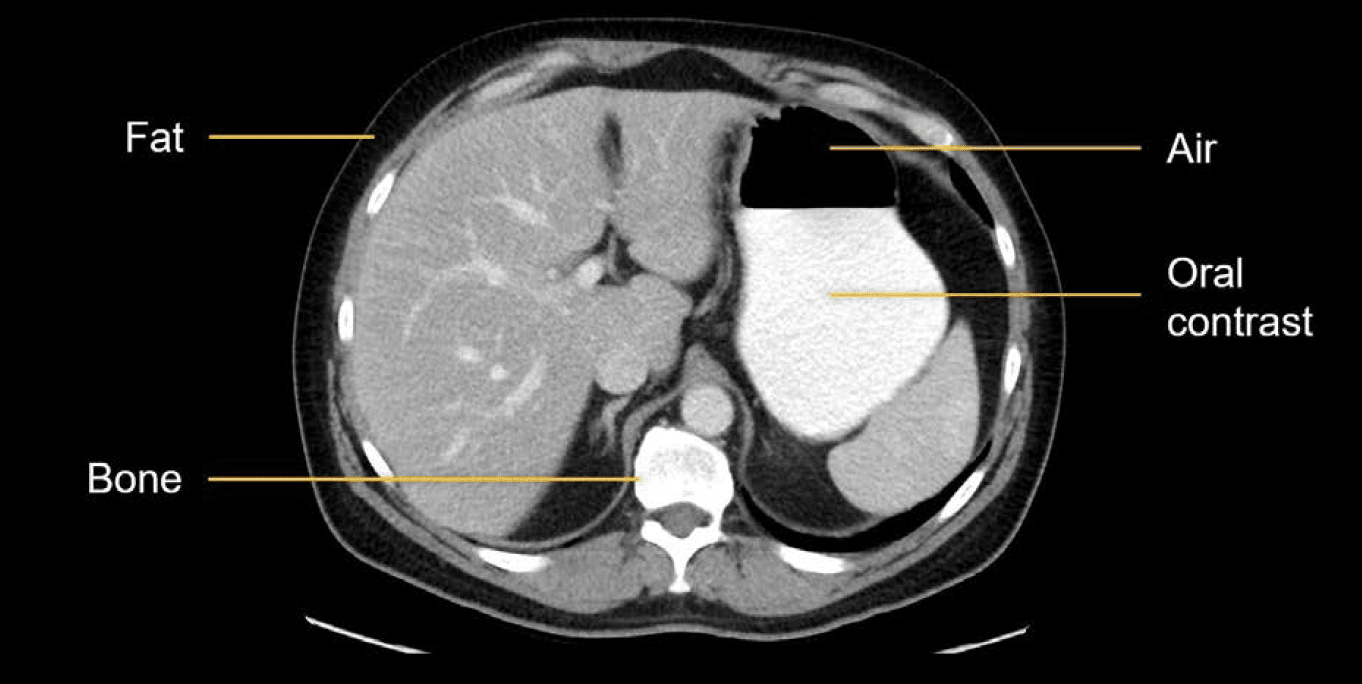
The ability to block x-rays is also referred to as attenuation, where high attenuation structures appear brighter and low attenuation structures appear darker.
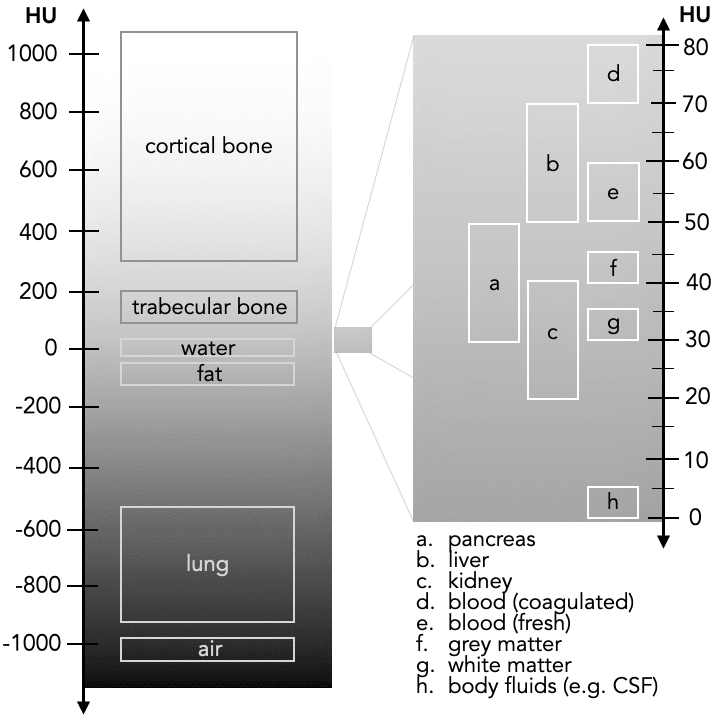
Attenuation is represented both by the grey scale appearance in the image and a numerical value that you can measure. This value is called the Hounsfield unit (HU). The higher the number, the more x-rays the structure blocks. So, a high attenuation structure like bone will have a higher HU value than low attenuation structures like fat or air.
By drawing a region of interest (ROI) over the structure, you can obtain the attenuation value and more precise information about the structure’s density. This can be thought of as a radiology magnifying glass.
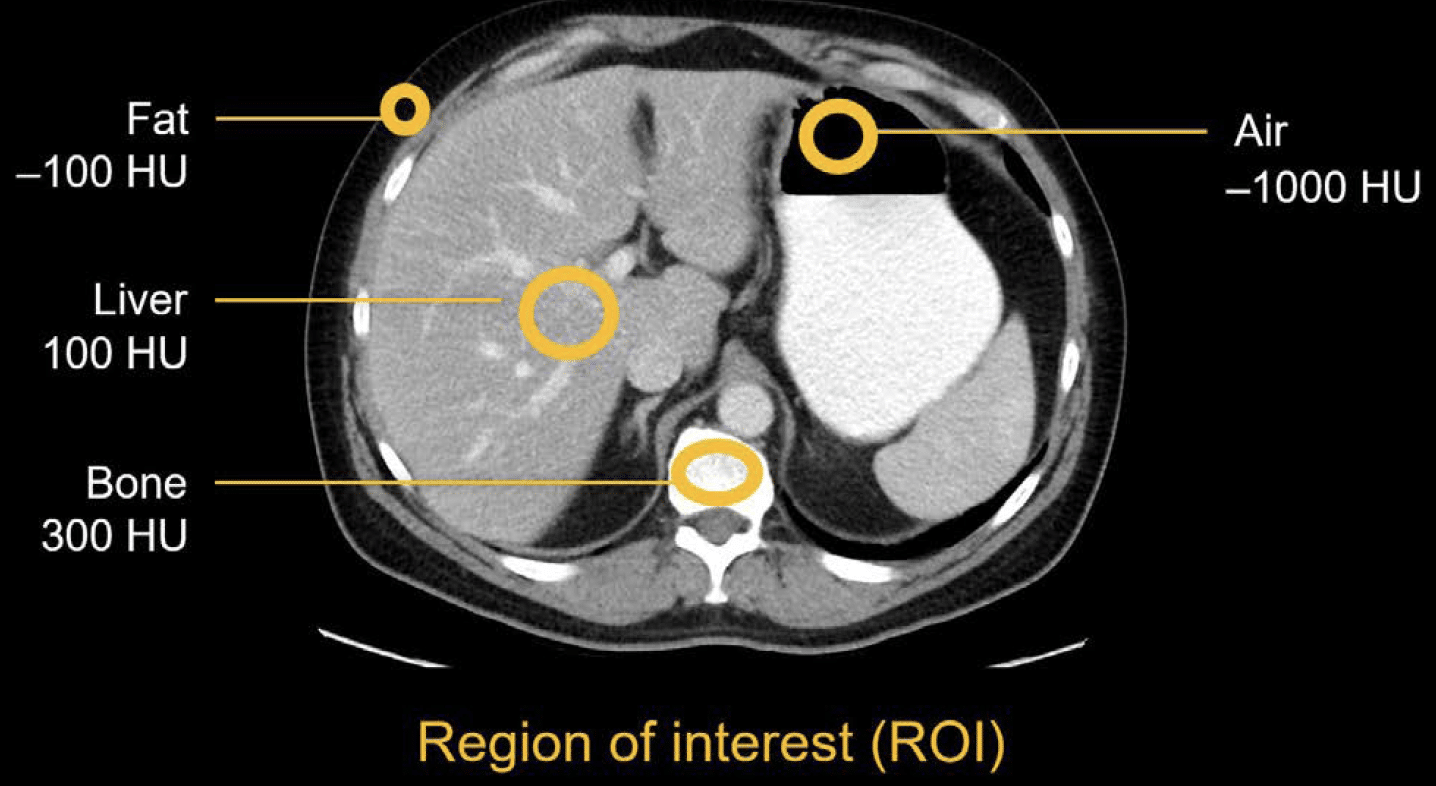
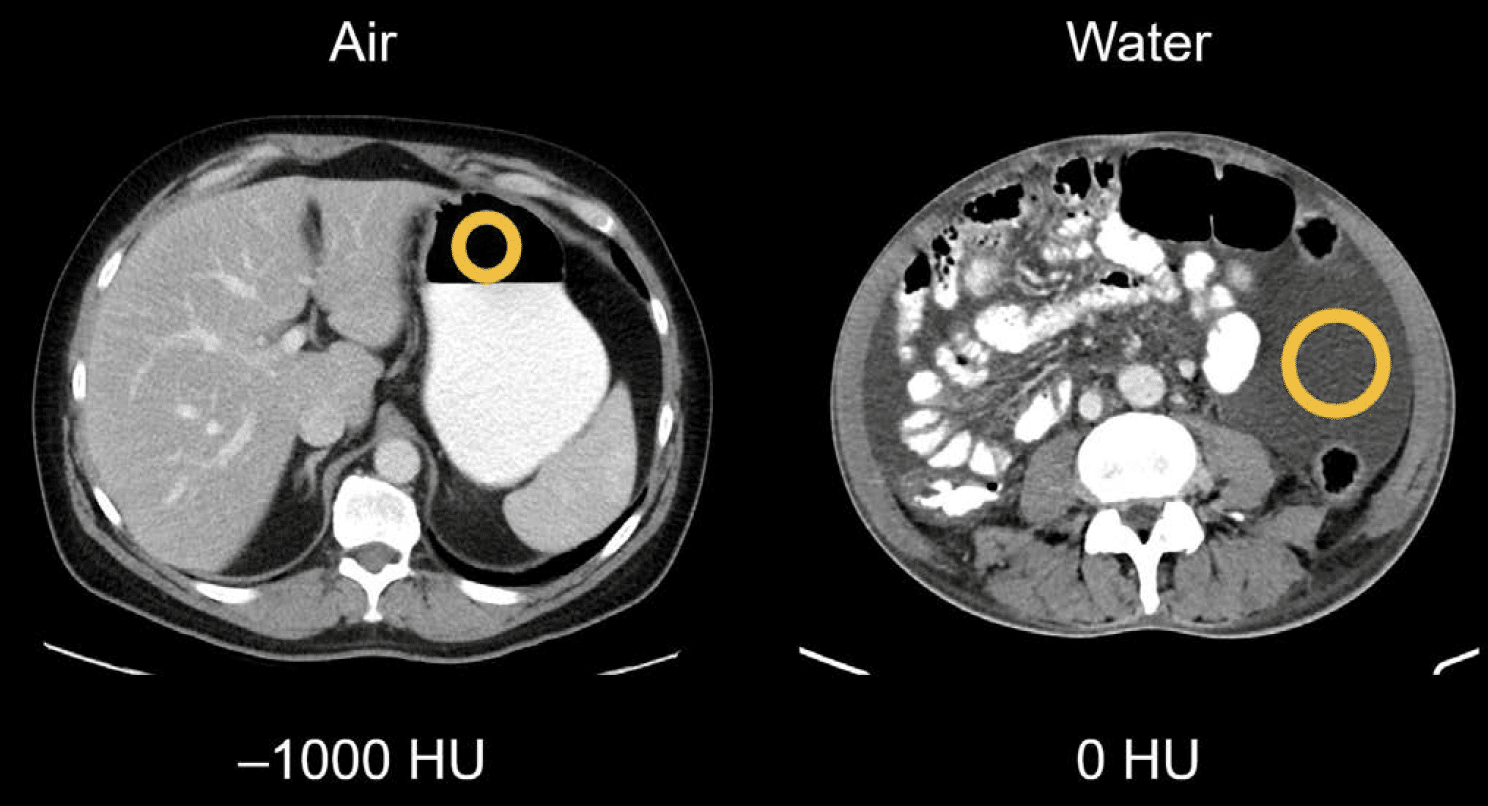
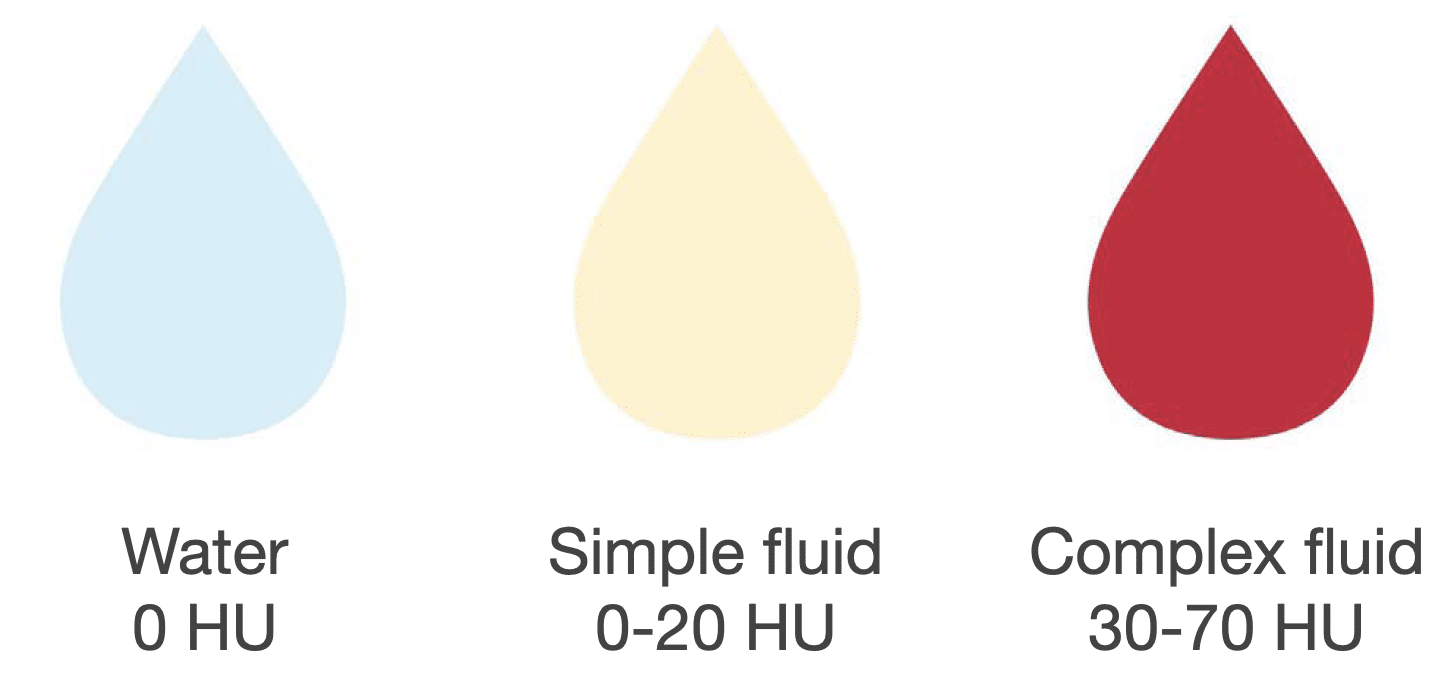
By convention, two structures are assigned values that are used to calibrate all of the other values:
- Air is –1000 HU
- Water is 0 HU
Since water is the zero point, it can be used as the starting point to characterise other fluid types. For instance, a simple fluid such as ascites is within the range of 0–20 HU, whereas a complex fluid like blood, which might occur with trauma, is within the range of 30–70 HU.
How do we use attenuation to detect abnormalities?
We can use attenuation to interrogate CT images for fluid, masses and fatty infiltration.
Fluid
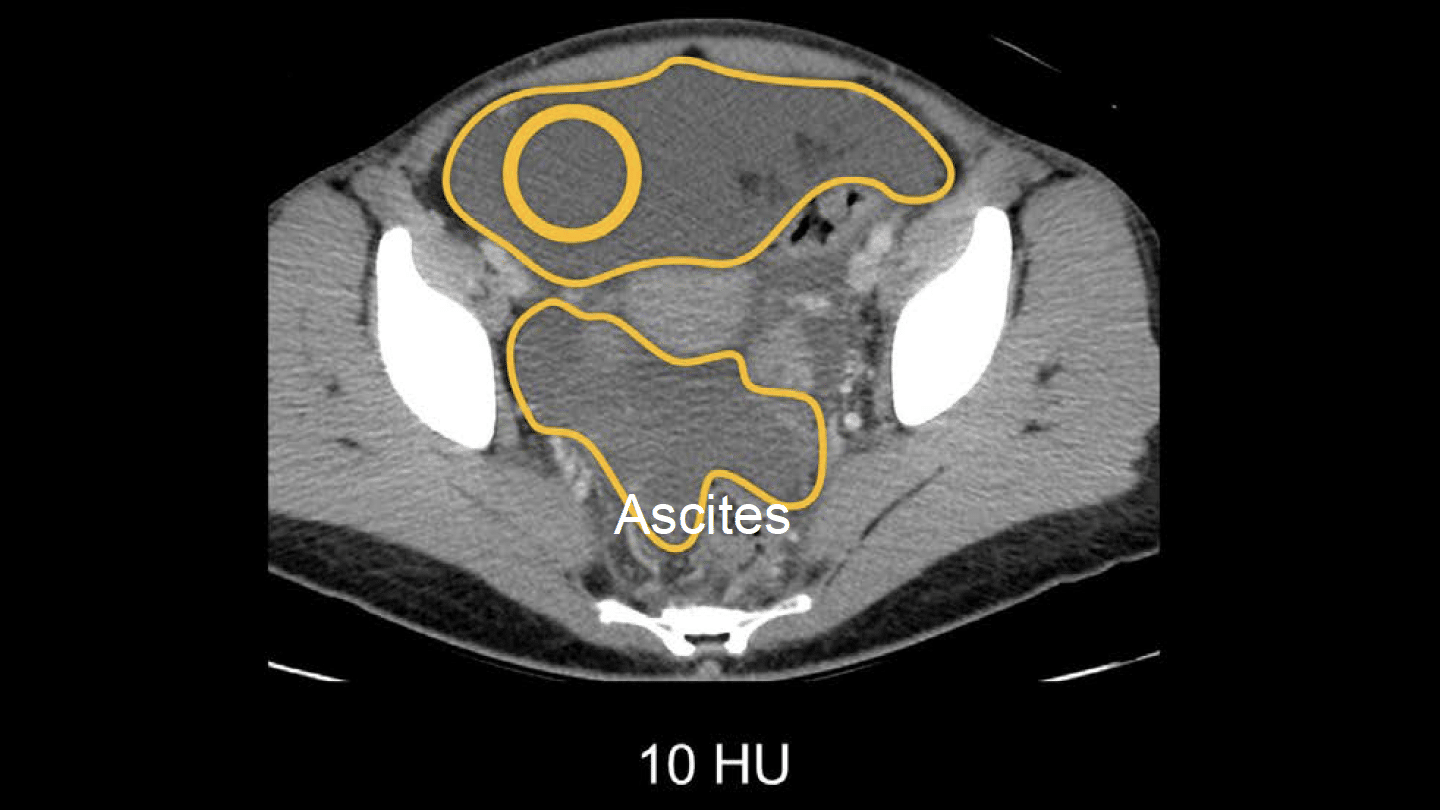
Example 1: Fluid and attenuation
In the CT scan below, the pelvic fluid measures 10 HU. From this, we can infer the accumulation of a simple fluid in the abdomen, also known as ascites, which is commonly associated with cirrhotic liver disease.
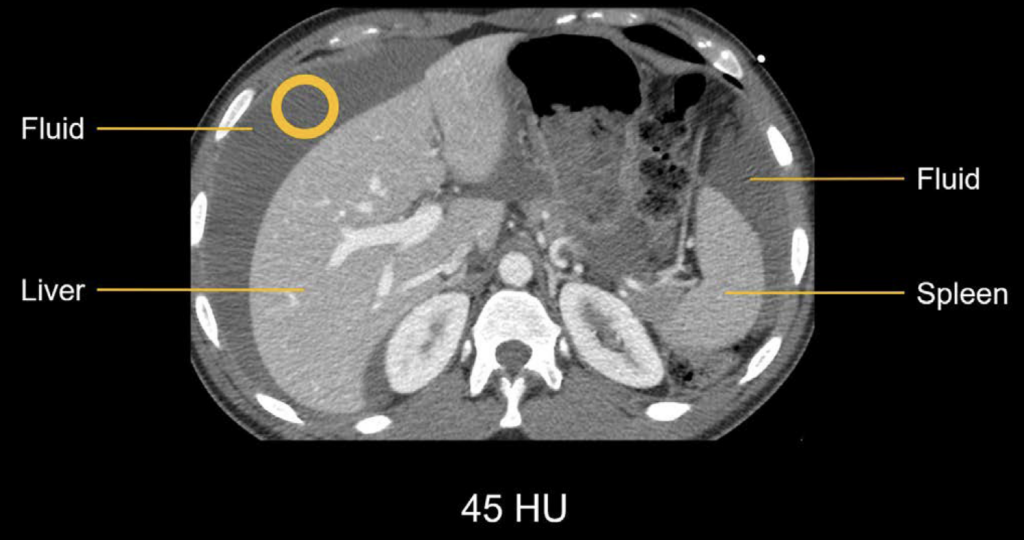
Example 2: Complex fluid and attenuation
In the next example, the fluid around the liver and spleen has been measured to be 45 HU. This is higher than simple fluid and indicates complex fluid. Because this patient is presenting with trauma, this fluid is suspicious for blood products due to an intraabdominal injury, prompting a careful review of the images to look for the source of the bleeding.
Masses
In addition to assessing fluid, measuring attenuation can also be useful for masses. When characterising adrenal, kidney, or ovarian masses, you can check the attenuation value for fat or enhancement. This can help determine if a lesion is benign or possibly cancerous
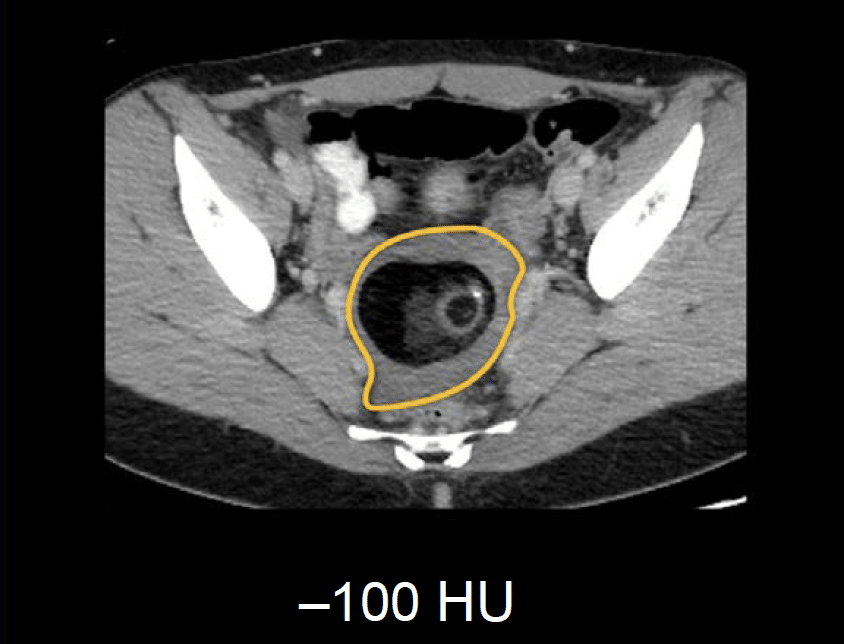
Example 3: Ovarian mass
Below is an example of an ovarian mass. If we draw a region of interest circle over the darkest part of the mass, the attenuation measures –100 HU, which is consistent with fat. This information helps us to confidently give the diagnosis of a benign fat-containing mass of the ovary called a mature teratoma.
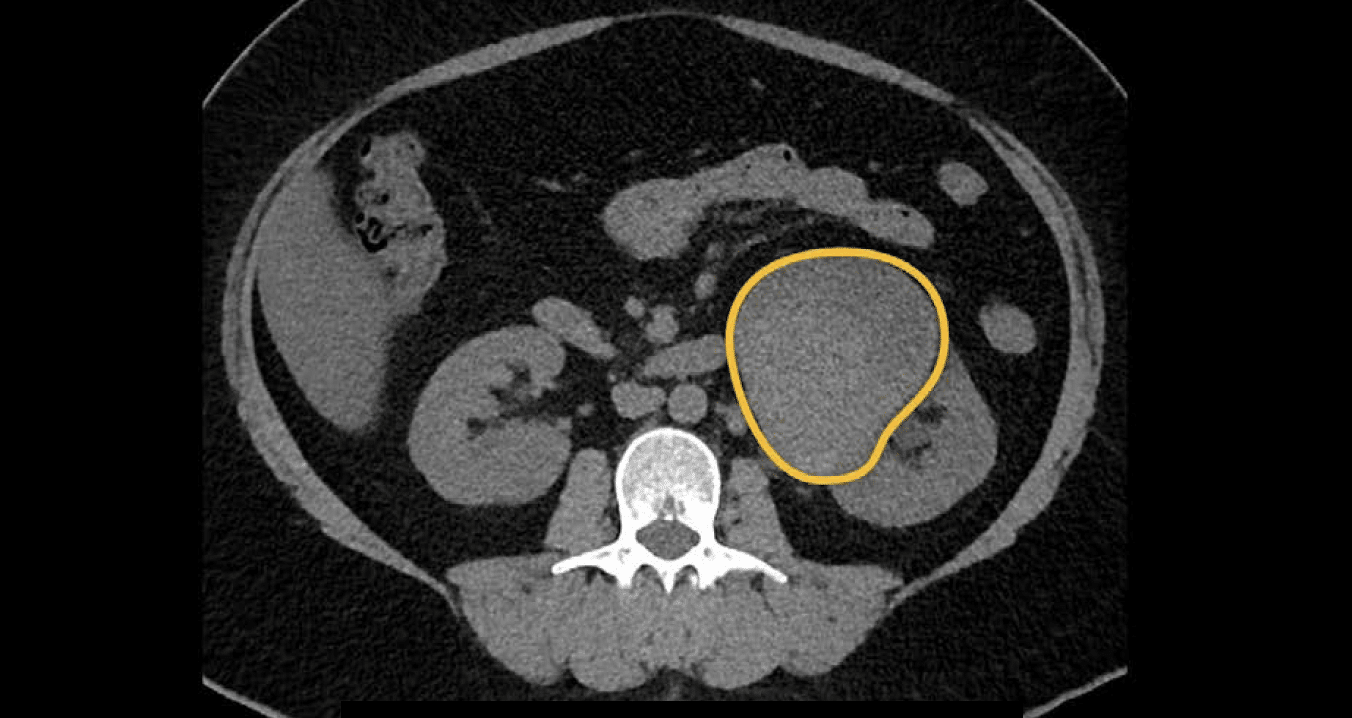
Example 4: Renal mass
Non-contrast CT image from a patient with a large mass in the left kidney. We want to look for vascular flow which would indicate that it is not a cyst and may be cancerous. To determine this, you will need to acquire images both before and after the patient is given contrast to see whether the mass shows enhancement, which means it should get brighter after contrast is given. As contrast is carried by the blood, enhancement would indicate blood flowing into the mass.
When we zoom in on the mass, we can see that the density is variable, and coming to a diagnosis using visual comparison may be challenging. Checking the HU may help. By drawing a region of interest over the mass in the same area on both images, the HU value indicates increased enhancement with contrast.
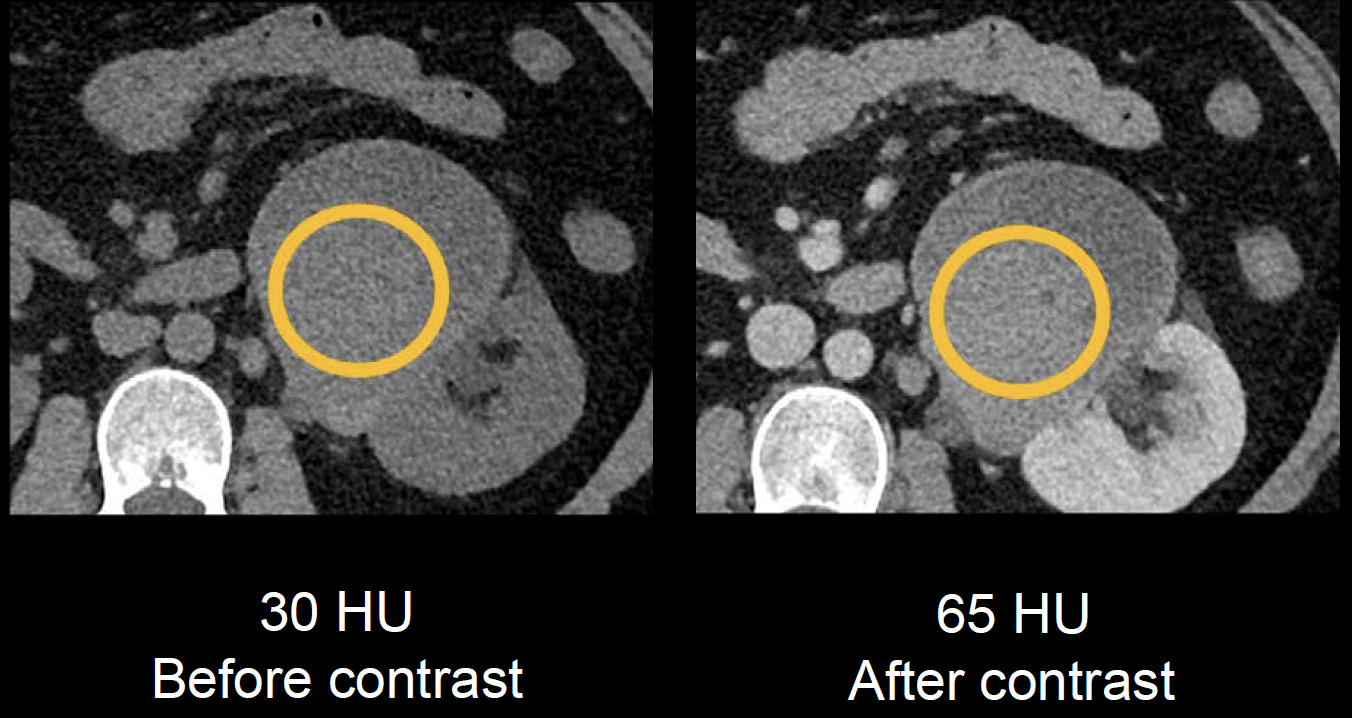
By subtracting the non-contrast HU value from the post-contrast HU value, you can determine a difference in perceived enhancement (i.e. brightness) with more accuracy.
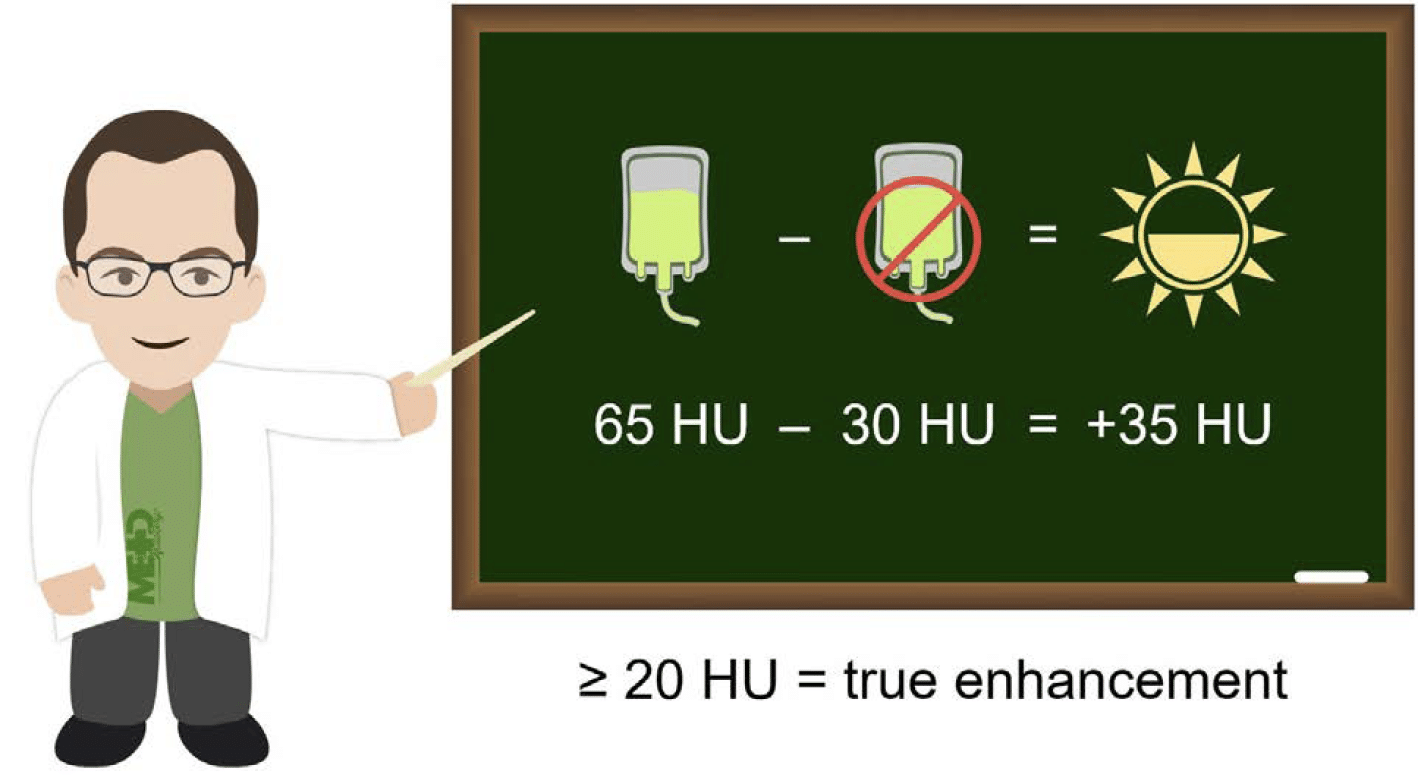
If we subtract the non-contrast value of 30 HU from the post-contrast value of 65 HU, we can calculate an increase in brightness of 35 HU. An increase of 20 HU or more generally means you can be sure it is truly enhancing. Thus, we can say that this is an enhancing mass and that it might be cancerous, needing further evaluation such as a biopsy.
Fatty infiltration
The evaluation of fatty infiltration of the liver is another useful application of attenuation values. This involves a comparison of the liver and spleen and is most reliable on non-contrast images.
Example 5: Fatty infiltration
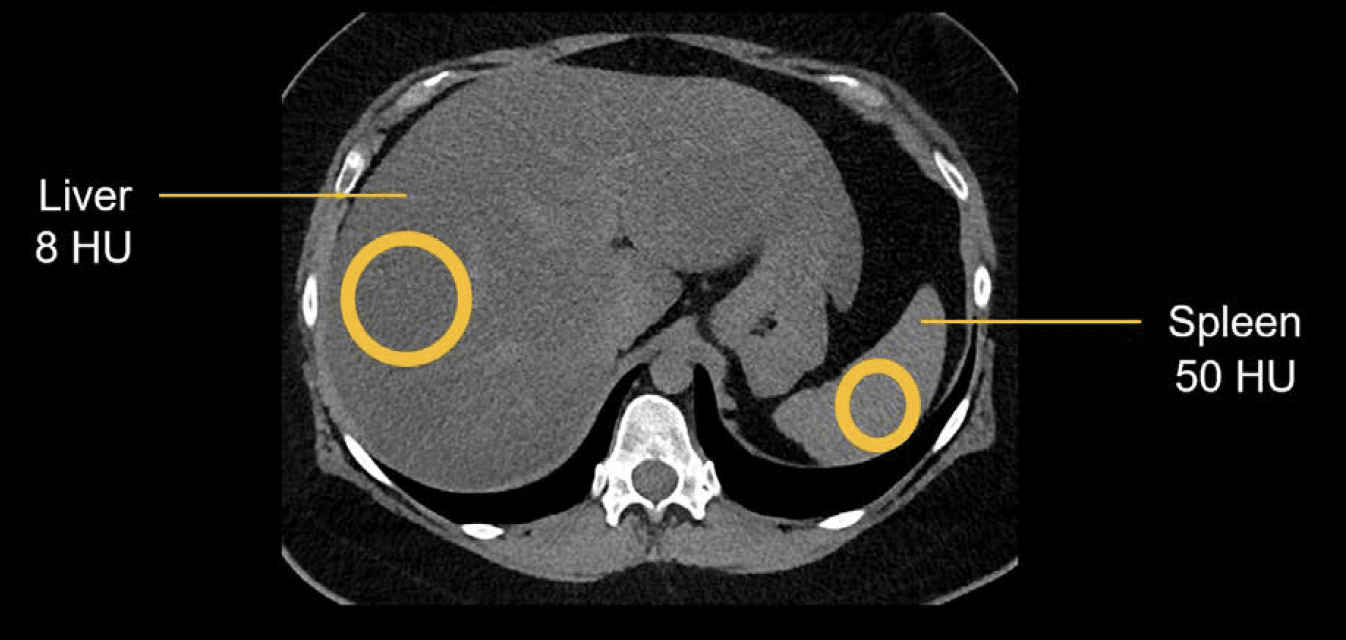
Non-contrast image showing the liver and the spleen. By drawing a region of interest on both structures, you can use the HU values to determine the amount of fat in the liver tissue.
For this you can consider two cutoff points that indicate fat infiltration:
- If the liver measures less than 40 HU
- If the liver measures less than the spleen by at least 10 HU
Note: this comparison only works on a non-contrast CT.
In the example above, the liver measures 8 HU and the spleen measures 50 HU. We know that 8 HU is less than 40, and 8 HU is 42 HU less than the spleen. Therefore, both cutoffs have been met, and you can confidently diagnose fatty liver disease or hepatic steatosis.
This is an edited excerpt from the Medmastery course Abdominal CT Essentials by Michael P. Hartung, MD. Acknowledgement and attribution to Medmastery for providing course transcripts.
- Hartung MP. Abdominal CT: Common Pathologies. Medmastery
- Hartung MP. Abdominal CT: Essentials. Medmastery
- Hartung MP. Abdomen CT: Trauma. Medmastery
References
- Top 100 CT scan quiz. LITFL
Radiology Library: Abdominal CT Basics
- Hartung MP. What is the role of Abdominal CT? LITFL
- Hartung MP. Abdominal CT: Basics. LITFL
- Hartung MP. Abdominal CT: Common Terms. LITFL
- Hartung MP. Abdominal CT: Planes. LITFL
- Hartung MP. Abdominal CT: Measuring attenuation. LITFL
- Hartung MP. Abdominal CT: Windows settings (basics). LITFL
- Hartung MP. Abdominal CT: Windows settings (advanced). LITFL
Abdominal CT interpretation

Assistant Professor of Abdominal Imaging and Intervention at the University of Wisconsin Madison School of Medicine and Public Health. Interests include resident and medical student education, incorporating the latest technology for teaching radiology. I am also active as a volunteer teleradiologist for hospitals in Peru and Kenya. | Medmastery | Radiopaedia | Website | Twitter | LinkedIn | Scopus

MBChB (hons), BMedSci - University of Edinburgh. Living the good life in emergency medicine down under. Interested in medical imaging and physiology. Love hiking, cycling and the great outdoors.