![]()
Pericarditis
Definition
Inflammation of the pericardium secondary to infection, localised injury or systemic disorders producing characteristic chest pain, dyspnoea and serial ECG changes.
- Chest pain is often retrosternal in nature, pleuritic, and positional (relieved by sitting forward, worse lying flat)
- There may be an associated pericardial friction rub, or ECG evidence of a pericardial effusion
- Widespread ST segment changes occur due to involvement of the underlying epicardium (i.e. myopericarditis)
- TTE is useful in the early assessment of patients with suspected pericarditis to look for complications such as large pericardial effusion and cardiac tamponade
Characteristic ECG changes
- Widespread concave ST elevation and PR depression throughout most of the limb leads (I, II, III, aVL, aVF) and precordial leads (V2-6)
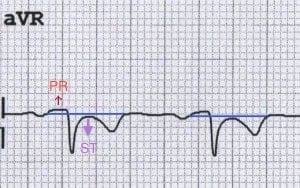
- Reciprocal ST depression and PR elevation in lead aVR (± V1)
- Sinus tachycardia is also common in acute pericarditis due to pain and/or pericardial effusion
NB. ST- and PR-segment changes are relative to the baseline formed by the T-P segment. The degree of ST elevation is typically modest (0.5 – 1mm).

Stages of Pericarditis
Pericarditis is classically associated with ECG changes that evolve through four stages.
- Stage 1 – widespread STE and PR depression with reciprocal changes in aVR (occurs during the first two weeks)
- Stage 2 – normalisation of ST changes; generalised T wave flattening (1 to 3 weeks)
- Stage 3 – flattened T waves become inverted (3 to several weeks)
- Stage 4 – ECG returns to normal (several weeks onwards)
NB. Less than 50% of patients progress through all four classical stages and evolution of changes may not follow this typical pattern.
Causes of Pericarditis
Classification can be primary versus secondary, acute versus chronic, or infectious versus immune-mediated.
- Infectious – mainly viral (e.g. coxsackie virus); occasionally bacterial, fungal, TB.
- Immunological – SLE, rheumatic fever
- Uraemia
- Post-myocardial infarction or following cardiac surgery (Dressler’s syndrome)
- Trauma
- Paraneoplastic syndromes
- Drug-induced (e.g. isoniazid, cyclosporin)
- Post-radiotherapy
ECG Examples
Example 1
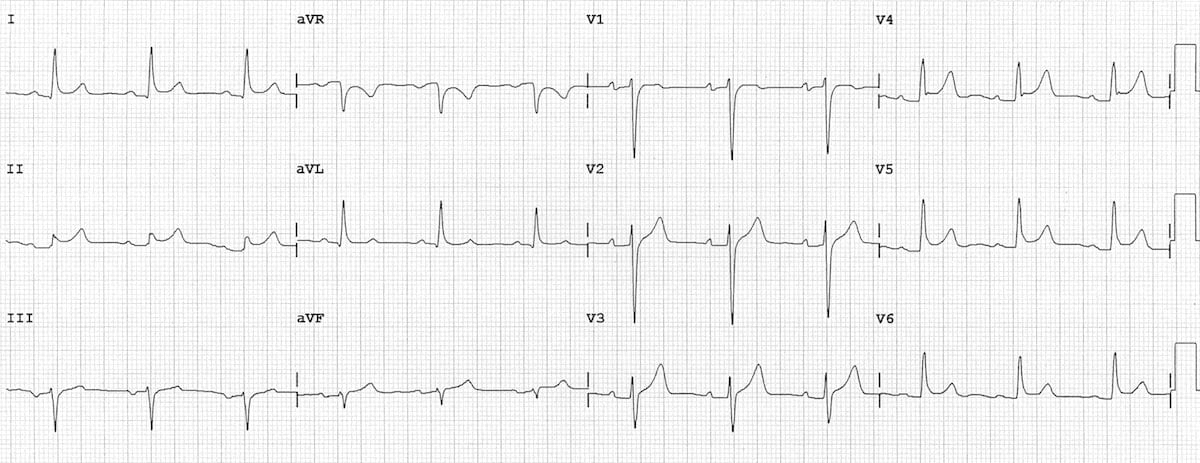
Acute Pericarditis:
- Widespread concave ST elevation and PR depression is present throughout the precordial (V2-6) and limb leads (I, II, aVL, aVF).
- There is reciprocal ST depression and PR elevation in aVR.
Example 2
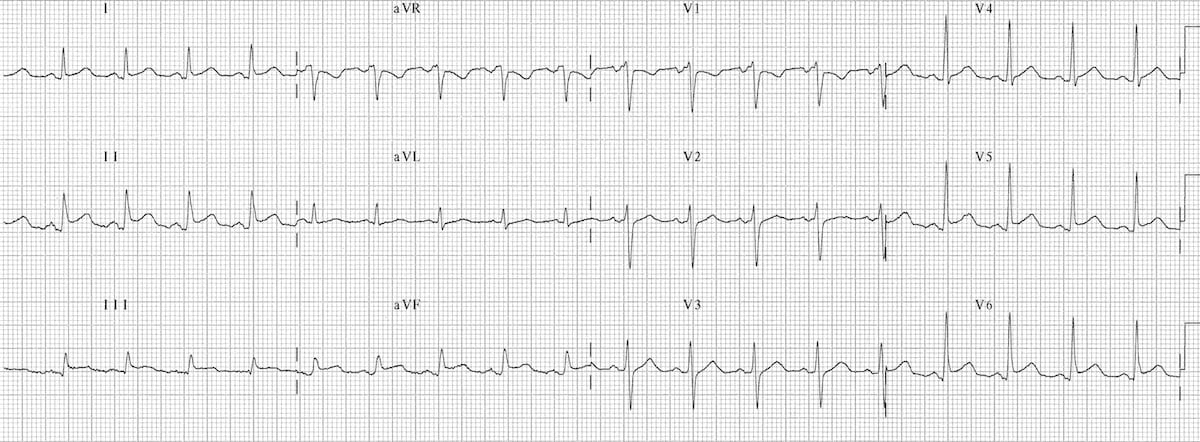
Acute Pericarditis:
- Sinus tachycardia
- Widespread concave STE and PR depression (I, II, III, aVF, V4-6)
- Reciprocal ST depression and PR elevation in V1 and aVR
- Spodick’s sign best visualised in lead II
Example 3
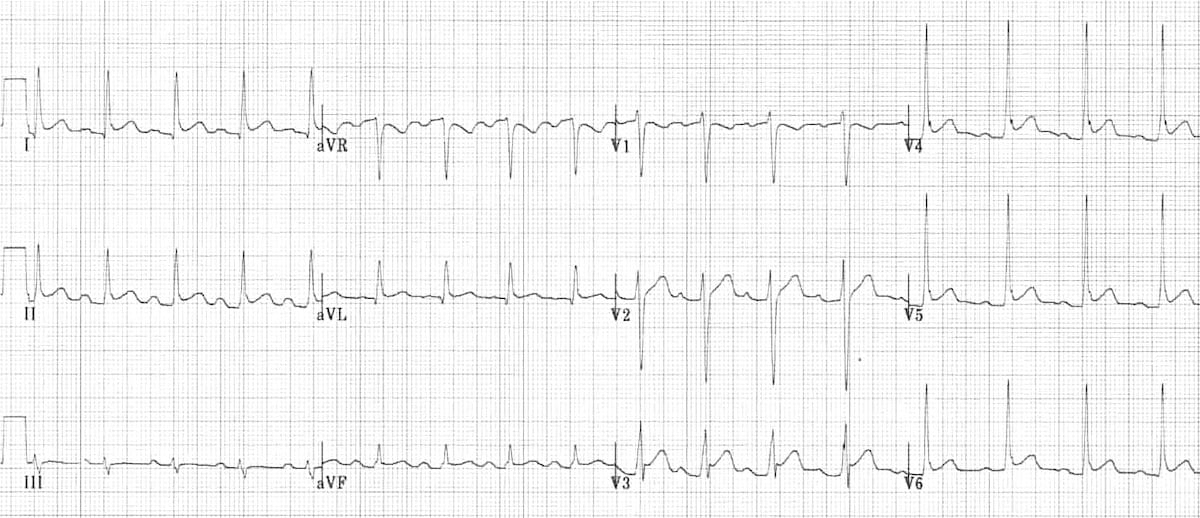
Another typical example of pericarditis with:
- Widespread ST elevation and PR depression
- Reciprocal ST depression and PR elevation in V1 and aVR
Example 4
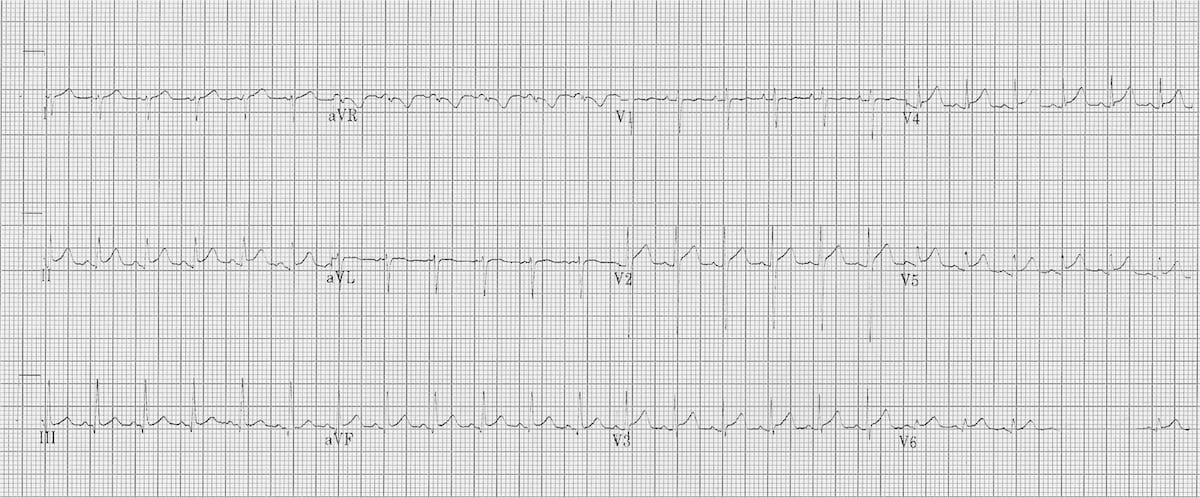
Acute Myopericarditis:
- Marked sinus tachycardia (145 bpm)
- Widespread subtle concave ST elevation with PR depression, most obvious in the precordial (V2-6) and inferior leads (II, III, aVF).
- There is reciprocal ST depression and PR elevation in aVR.
This (sadly slightly faded) ECG was taken from a 6-year old child with viral pericarditis, hence the tachycardia is age-appropriate. The child also had evidence of myocardial involvement with elevated cardiac enzymes (i.e. myopericarditis) .
Pericarditis vs Benign Early Repolarisation
Pericarditis can be difficult to differentiate from Benign Early Repolarisation (BER) as both conditions are associated with concave ST elevation. One useful trick to distinguish between these two entities is to look at the ST segment / T wave ratio and the Fish Hook Pattern
ST segment / T wave ratio:
- The vertical height of the ST segment elevation (from the end of the PR segment to the J point) is measured and compared to the amplitude of the T wave in V6.
- A ratio of > 0.25 suggests pericarditis
- A ratio of < 0.25 suggests BER
Example 1
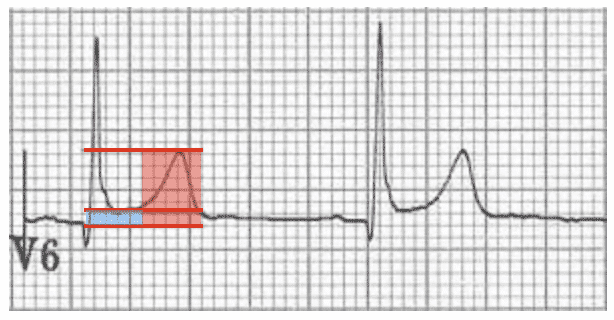
Benign Early Repolarisation
- ST segment height = 1 mm
- T wave height = 6 mm
- ST / T wave ratio = 0.16
- The ST / T wave ratio < 0.25 is consistent with BER.
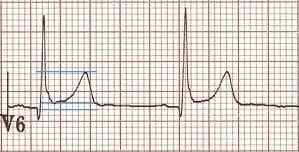
Example 2

Pericarditis
- ST segment height = 2 mm
- T wave height = 4 mm
- ST / T wave ratio = 0.5
- The ST / T wave ratio > 0.25 is consistent with pericarditis.
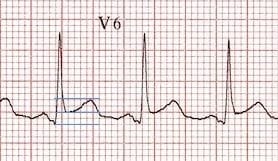
Fish Hook Pattern
Another clue that suggests BER is the presence of a notched or irregular J point: the so-called “fish hook” pattern. This is often best seen in lead V4.
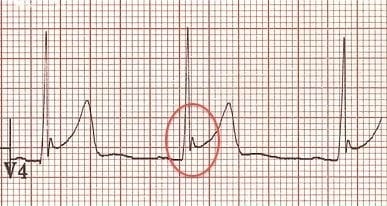
- Notched J-point elevation in V4 with a “fish hook” morphology, characteristic of BER.
The main differences between pericarditis and BER are summarised below. For more information visit the Benign Early Repolarisation (BER) library page.
Summary BER vs Pericarditis
Features suggesting BER
- ST elevation limited to the precordial leads
- Absence of PR depression
- Prominent T waves
- ST segment / T wave ratio < 0.25
- Characteristic “fish-hook” appearance in V4
- ECG changes usually stable over time (i.e non-progressive)
Features suggesting pericarditis
- Generalised ST elevation
- Presence of PR depression
- Normal T wave amplitude
- ST segment / T wave ratio > 0.25
- Absence of “fish hook” appearance in V4
- Dynamic ECG changes that evolve slowly over time
NB. These features have limited specificity, therefore it may not always be possible to tell the difference between these two conditions.
Try this ECG example
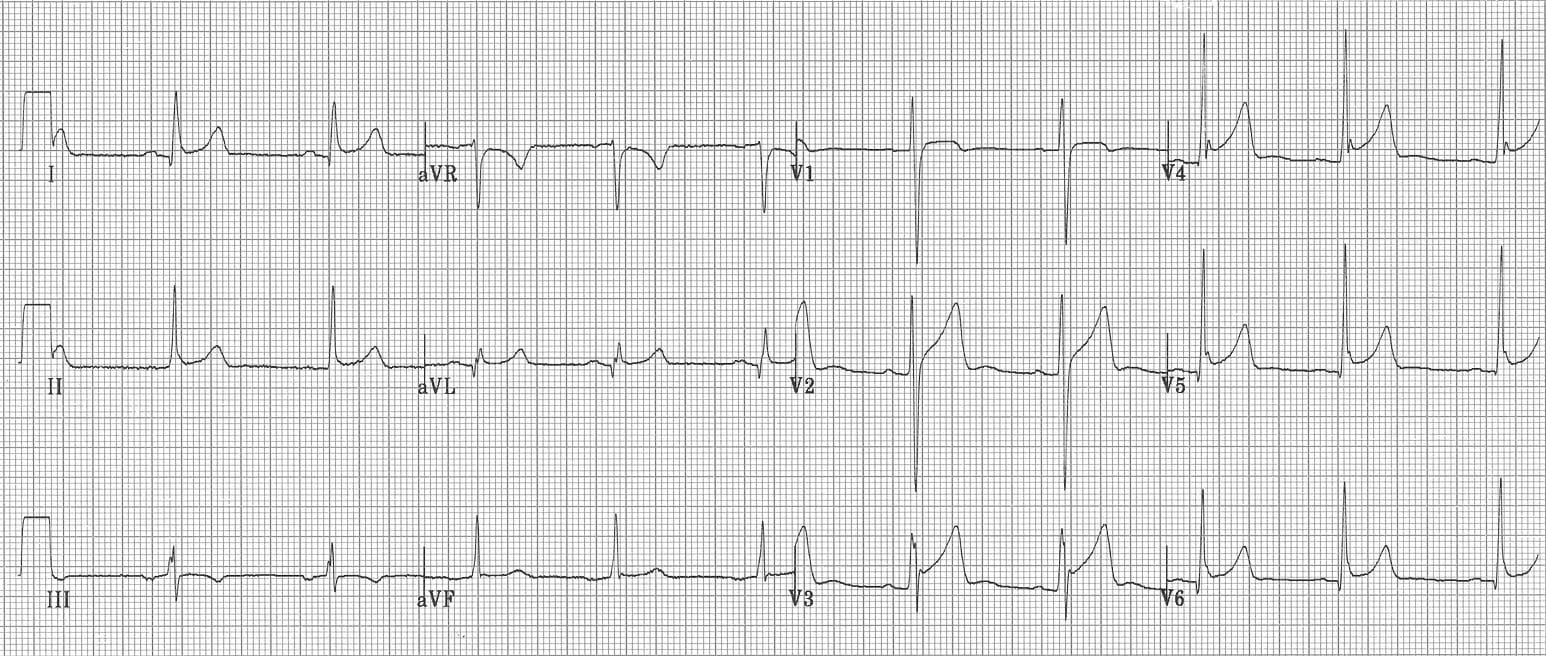
Is this BER or pericarditis?
Reveal the answer
- There is widespread concave ST elevation suggesting pericarditis.
- However, the ST elevation is markedly more prominent in the precordial leads (esp. V2-5), consistent with BER.
- There appears to be some subtle downsloping PR depression in the limb (I, aVL) and precordial leads (V3-6), with subtle PR elevation in aVR, suggesting pericarditis.
- The J wave notching (fish-hook pattern) in V3-V4 is highly suggestive of BER.
- There are prominent T waves in the precordial leads, suggestive of BER.
- The ST / T wave ratio of 0.16 is also consistent with a diagnosis of BER.
- These ECG appearances could be caused by BER alone, although it is possible that this ECG represents BER with superimposed pericarditis. This ECG demonstrates the difficulty in differentiating between these two very similar conditions.
- Remember that it is possible for a patient with BER to get pericarditis!
Pericarditis vs STEMI
Classic teaching of generalised concave up ST elevation and PR elevation in aVR is not reliable for distinguishing pericarditis from ST elevation myocardial infarction (STEMI).
- Pericarditis can cause localised ST elevation but there should be no reciprocal ST depression (except in AVR and V1).
- STEMI, like pericarditis, can also cause concave up ST elevation.
- Only STEMI causes convex up or horizontal ST elevation.
- ST elevation greater in III than II strongly suggests a STEMI.
- PR segment depression is only reliably seen in viral pericarditis, not by other causes. It is often only an early transient phenomenon (lasting only hours). MI can also cause PR segment depression due to atrial infarction (or PR segment elevation in aVR).
- You can’t rely on history either — STEMI can also cause positional or pleuritic pain. A pericardial friction rub
Look for features of STEMI first:
- Search for ST depression in leads other than aVR and V1
- Look for ST elevation in lead III > II
- Search for horizontal or convex upward ST elevation
If the above are absent, additional findings suggestive of pericarditis include:
- PR depression in multiple leads. This is suggestive of pericarditis, however 12% of patients with STEMI have associated PR depression
- Spodick’s sign
Get serial ECGs on any patient with chest pain
- …things may become more obvious with time!
Related Topics
References
- Spodick DH. Diagnostic electrocardiographic sequences in acute pericarditis. Significance of PR segment and PR vector changes. Circulation. 1973 Sep;48(3):575-80.
- Spodick DH. Electrocardiogram in acute pericarditis. Distributions of morphologic and axial changes by stages. Am J Cardiol. 1974 Apr;33(4):470-4.
- Makaryus JN et al. Diagnostic issues in the clinical management of pericarditis. Int J Clin Pract. 2010 Sep;64(10):1384-92.
- Chhabra L, Spodick DH. Ideal isoelectric reference segment in pericarditis: a suggested approach to a commonly prevailing clinical misconception. Cardiology. 2012;122(4):210-2.
- Maeba H. Isoelectric reference for pericarditis: TP may be better than PR. Cardiology. 2012;123(1):39-40
- Masek KP. ECG Diagnosis: Acute Pericarditis. Perm J. 2013 Fall; 17(4): e146.
- Witting MD et al. Evaluation of Spodick’s Sign and Other Electrocardiographic Findings as Indicators of STEMI and Pericarditis. J Emerg Med. 2020 Mar 25. pii: S0736-4679(20)30020-2.
Advanced Reading
Online
- Wiesbauer F, Kühn P. ECG Mastery: Yellow Belt online course. Understand ECG basics. Medmastery
- Wiesbauer F, Kühn P. ECG Mastery: Blue Belt online course: Become an ECG expert. Medmastery
- Kühn P, Houghton A. ECG Mastery: Black Belt Workshop. Advanced ECG interpretation. Medmastery
- Rawshani A. Clinical ECG Interpretation ECG Waves
- Smith SW. Dr Smith’s ECG blog.
- Wiesbauer F. Little Black Book of ECG Secrets. Medmastery PDF
Textbooks
- Zimmerman FH. ECG Core Curriculum. 2023
- Mattu A, Berberian J, Brady WJ. Emergency ECGs: Case-Based Review and Interpretations, 2022
- Straus DG, Schocken DD. Marriott’s Practical Electrocardiography 13e, 2021
- Brady WJ, Lipinski MJ et al. Electrocardiogram in Clinical Medicine. 1e, 2020
- Mattu A, Tabas JA, Brady WJ. Electrocardiography in Emergency, Acute, and Critical Care. 2e, 2019
- Hampton J, Adlam D. The ECG Made Practical 7e, 2019
- Kühn P, Lang C, Wiesbauer F. ECG Mastery: The Simplest Way to Learn the ECG. 2015
- Grauer K. ECG Pocket Brain (Expanded) 6e, 2014
- Surawicz B, Knilans T. Chou’s Electrocardiography in Clinical Practice: Adult and Pediatric 6e, 2008
- Chan TC. ECG in Emergency Medicine and Acute Care 1e, 2004
LITFL Further Reading
- ECG Library Basics – Waves, Intervals, Segments and Clinical Interpretation
- ECG A to Z by diagnosis – ECG interpretation in clinical context
- ECG Exigency and Cardiovascular Curveball – ECG Clinical Cases
- 100 ECG Quiz – Self-assessment tool for examination practice
- ECG Reference SITES and BOOKS – the best of the rest
ECG LIBRARY
Emergency Physician in Prehospital and Retrieval Medicine in Sydney, Australia. He has a passion for ECG interpretation and medical education | ECG Library |

MBBS FACEM DDU (Emergency) CCPU. Emergency Physician in Melbourne, Australia. Co-Ultrasound Lead for Emergency Medicine at The Alfred Hospital. Special interests in diagnostic and procedural ultrasound, medical education, and ECG interpretation. Editor of the LITFL ECG Library.