
![]()
ECG Axis Interpretation
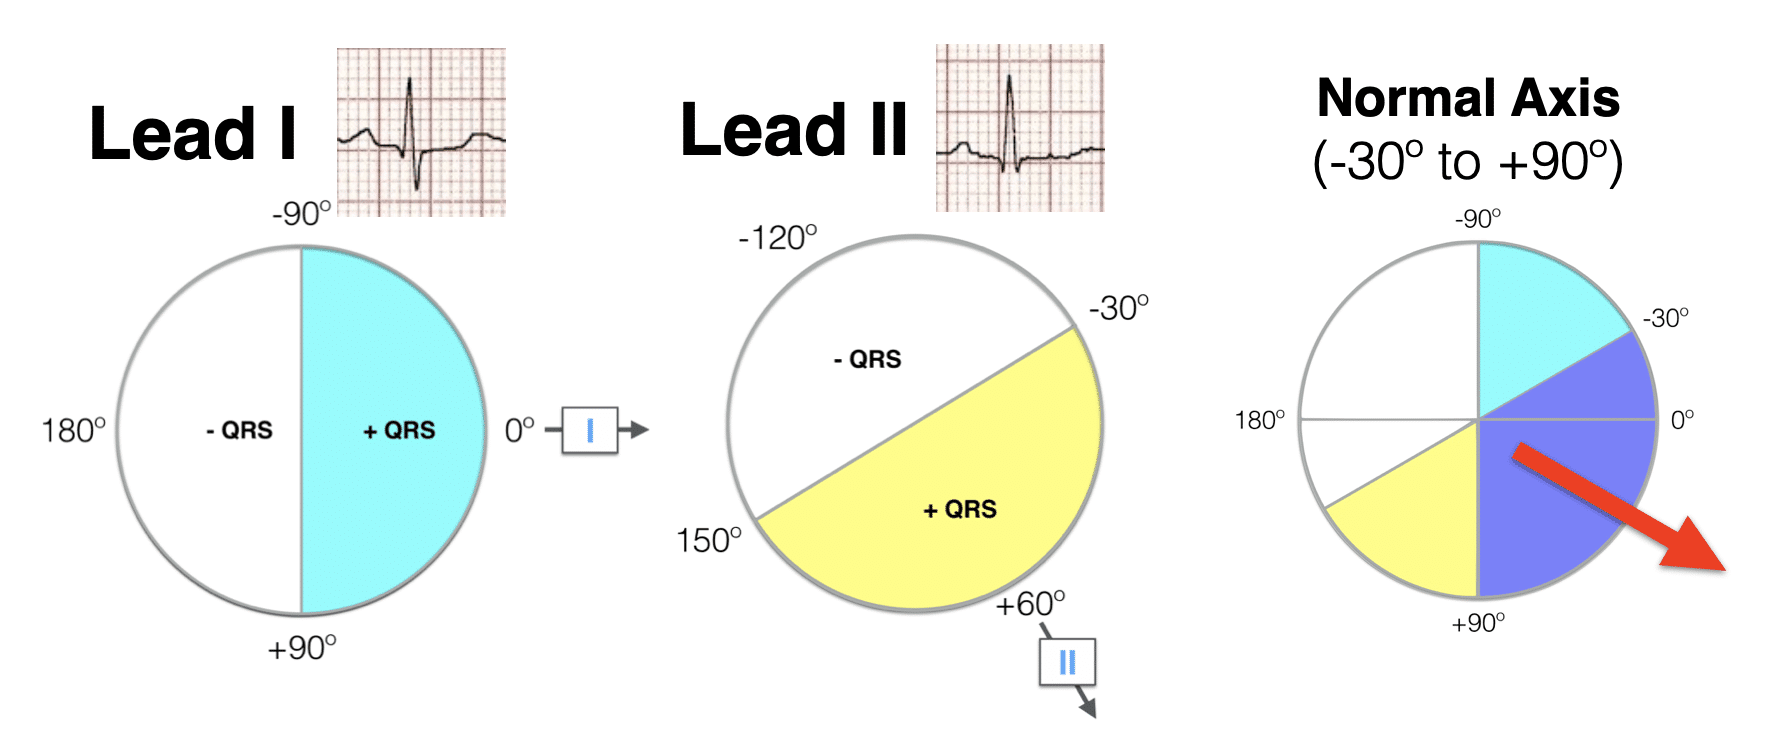
Cardiac axis represents the sum of depolarisation vectors generated by individual cardiac myocytes. Clinically is is reflected by the ventricular axis, and interpretation relies on determining the relationship between the QRS axis and limb leads of the ECG (below diagram)
Since the left ventricle makes up most of the heart muscle under normal circumstances, normal cardiac axis is directed downward and slightly to the left:
- Normal Axis = QRS axis between -30° and +90°.
Abnormal axis deviation, indicating underlying pathology, is demonstrated by:
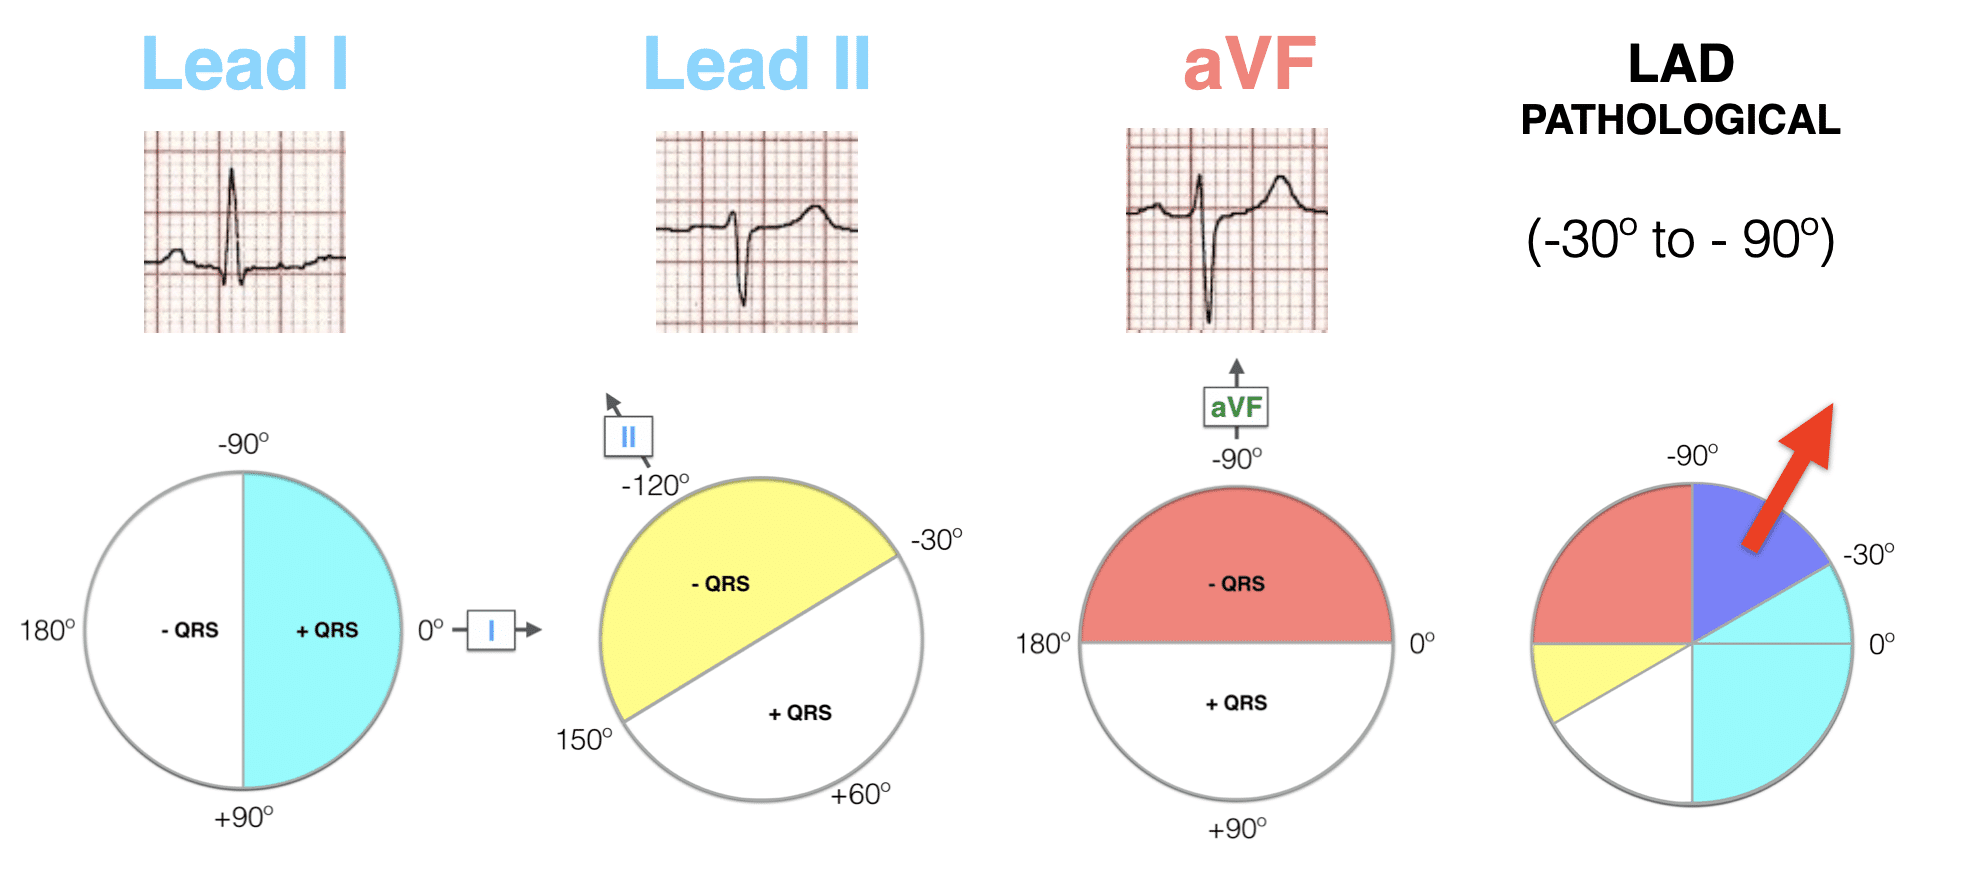
- Left Axis Deviation = QRS axis less than -30°.
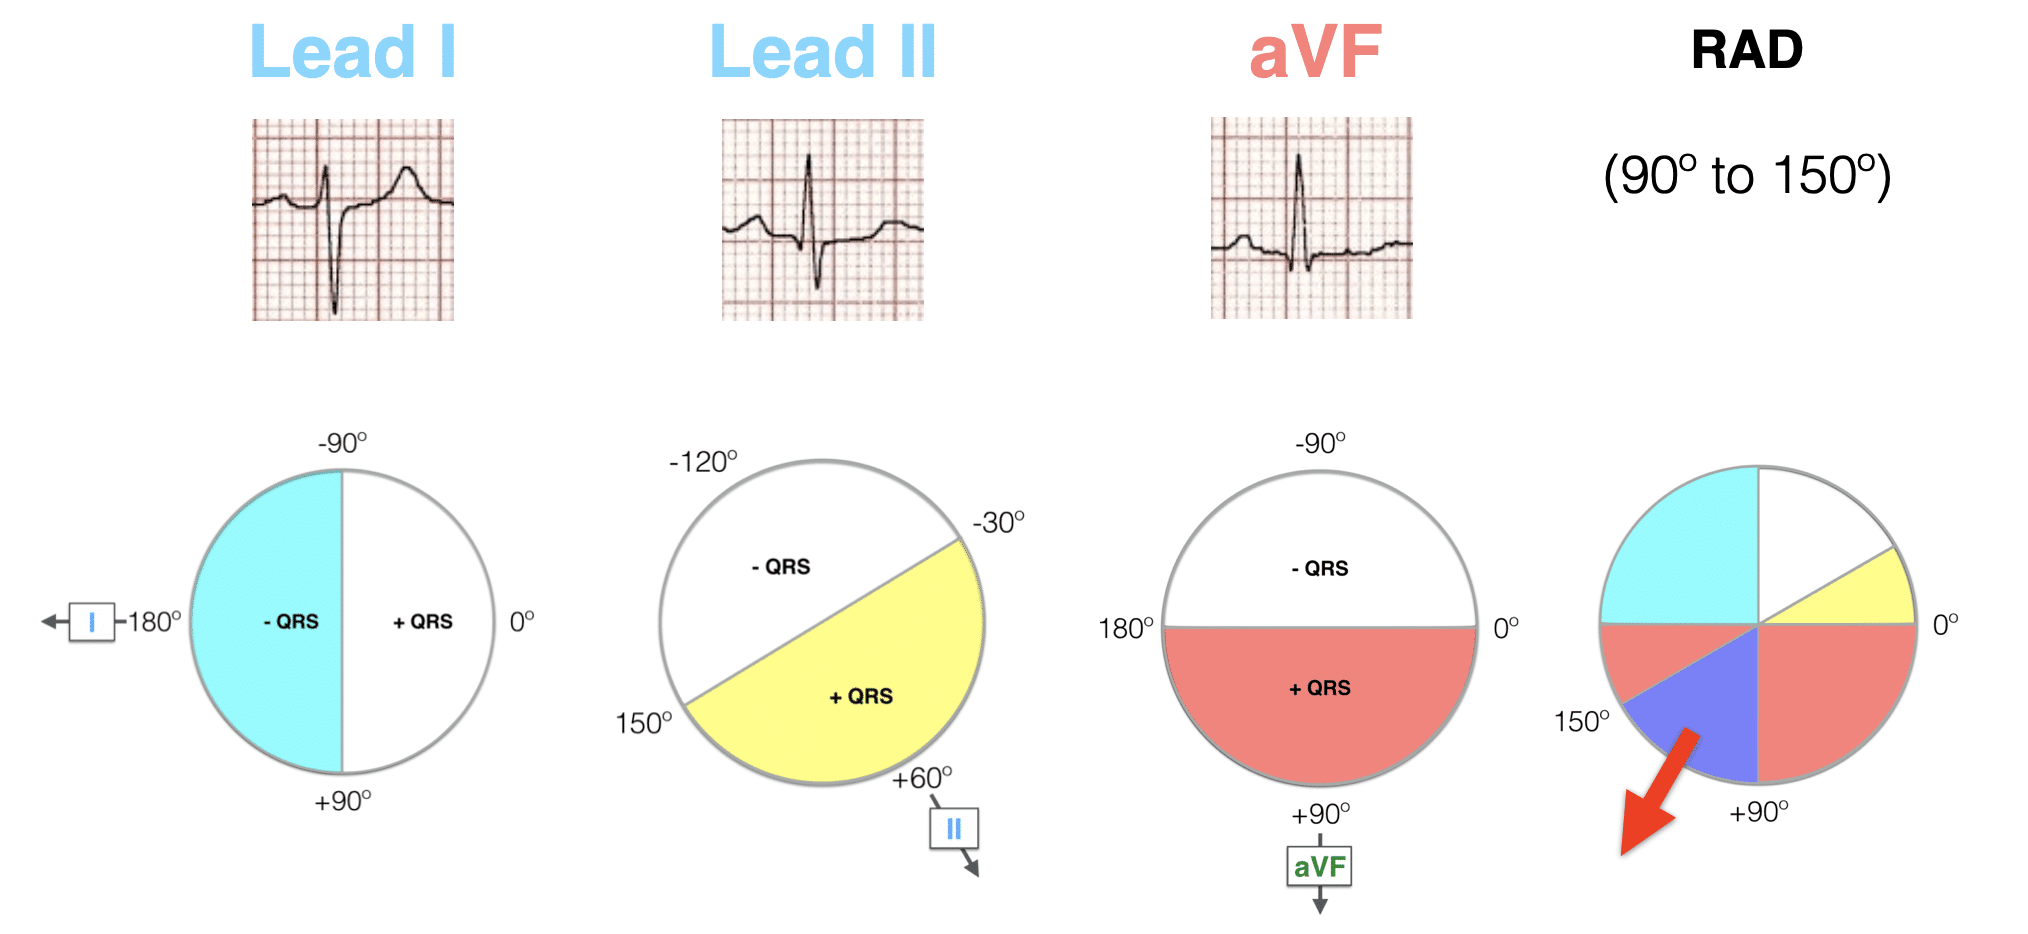
- Right Axis Deviation = QRS axis greater than +90°.
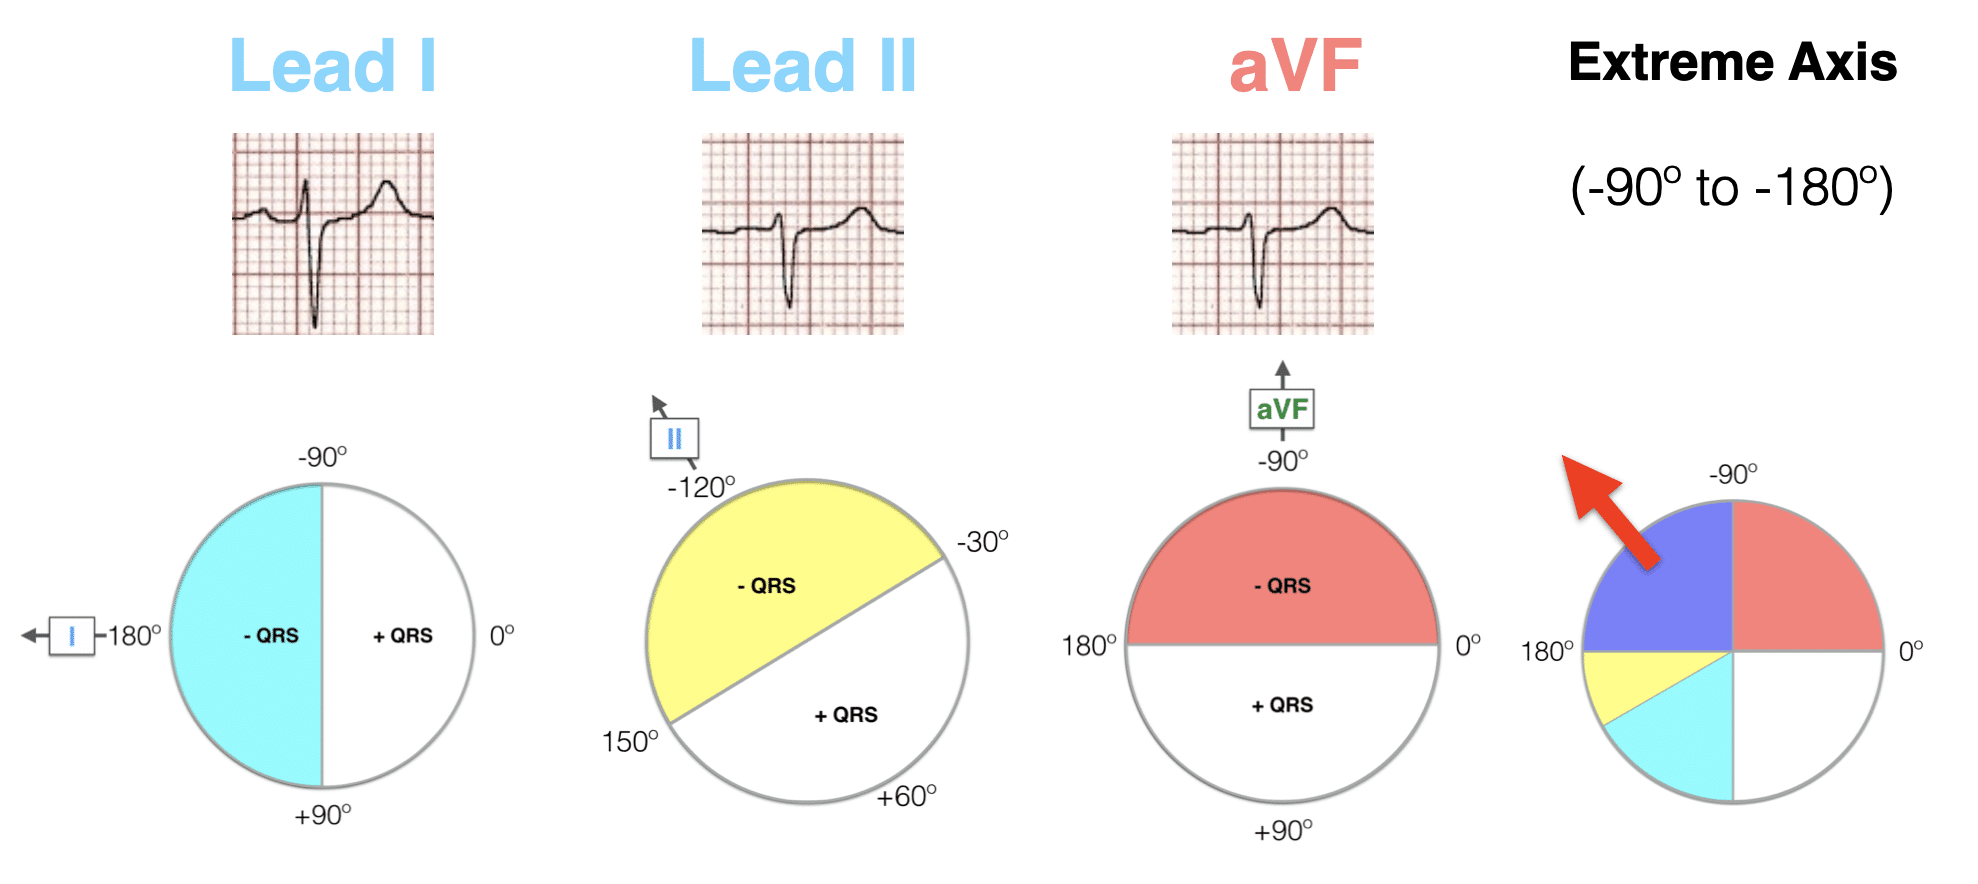
- Extreme Axis Deviation = QRS axis between -90° and 180° (AKA “Northwest Axis”).
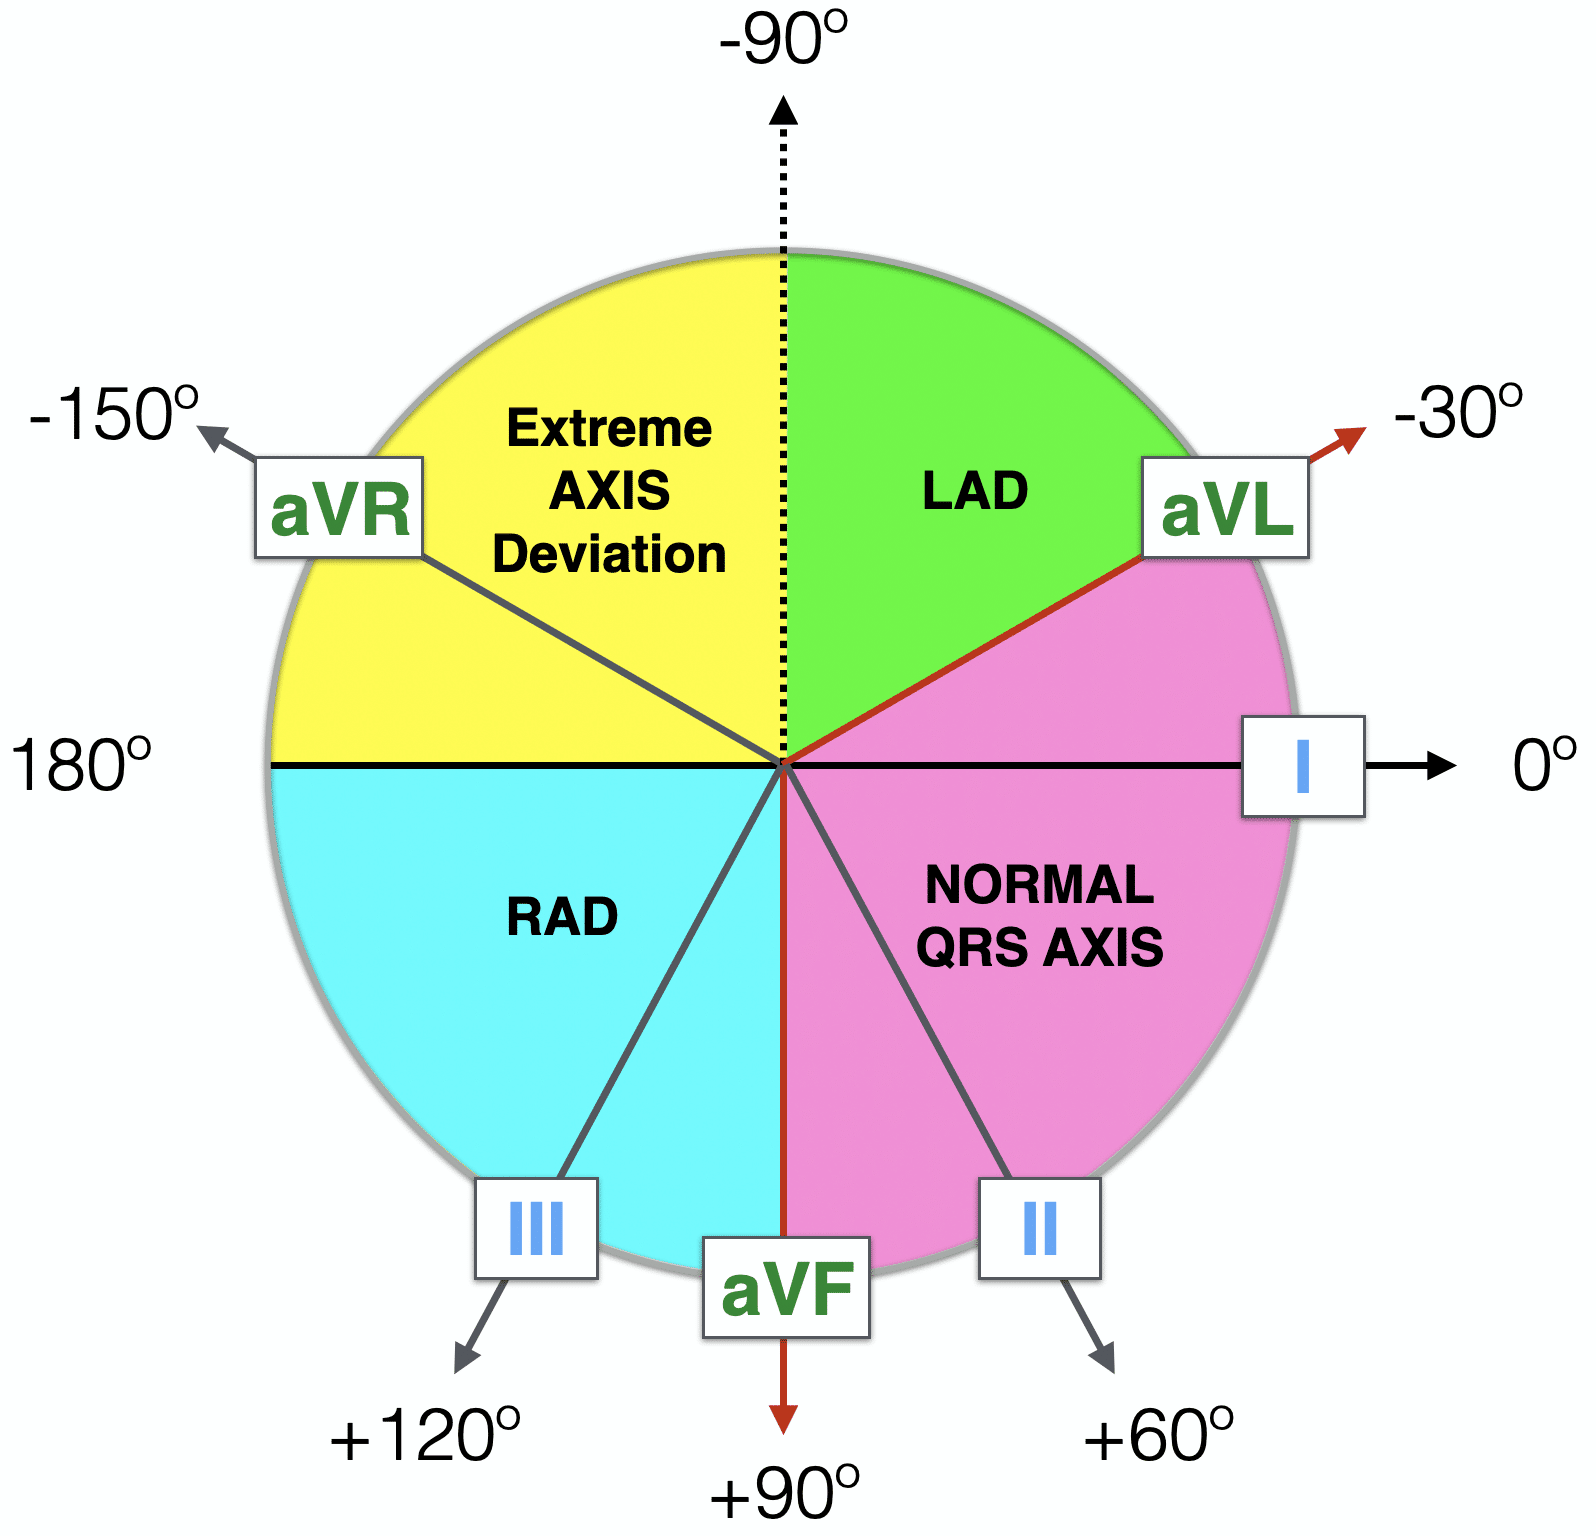
Note that in paediatric ECG interpretation, the cardiac axis lies between +30 to +190 degrees at birth and moves leftward with age.
Methods of ECG Axis Interpretation
There are several complementary approaches to estimating QRS axis, which are summarized below:
- The Quadrant Method – (Lead I and aVF)
- Three Lead analysis – (Lead I, Lead II and aVF)
- Isoelectric Lead analysis
- Super SAM the Axis Man
Method 1 – The Quadrant Method
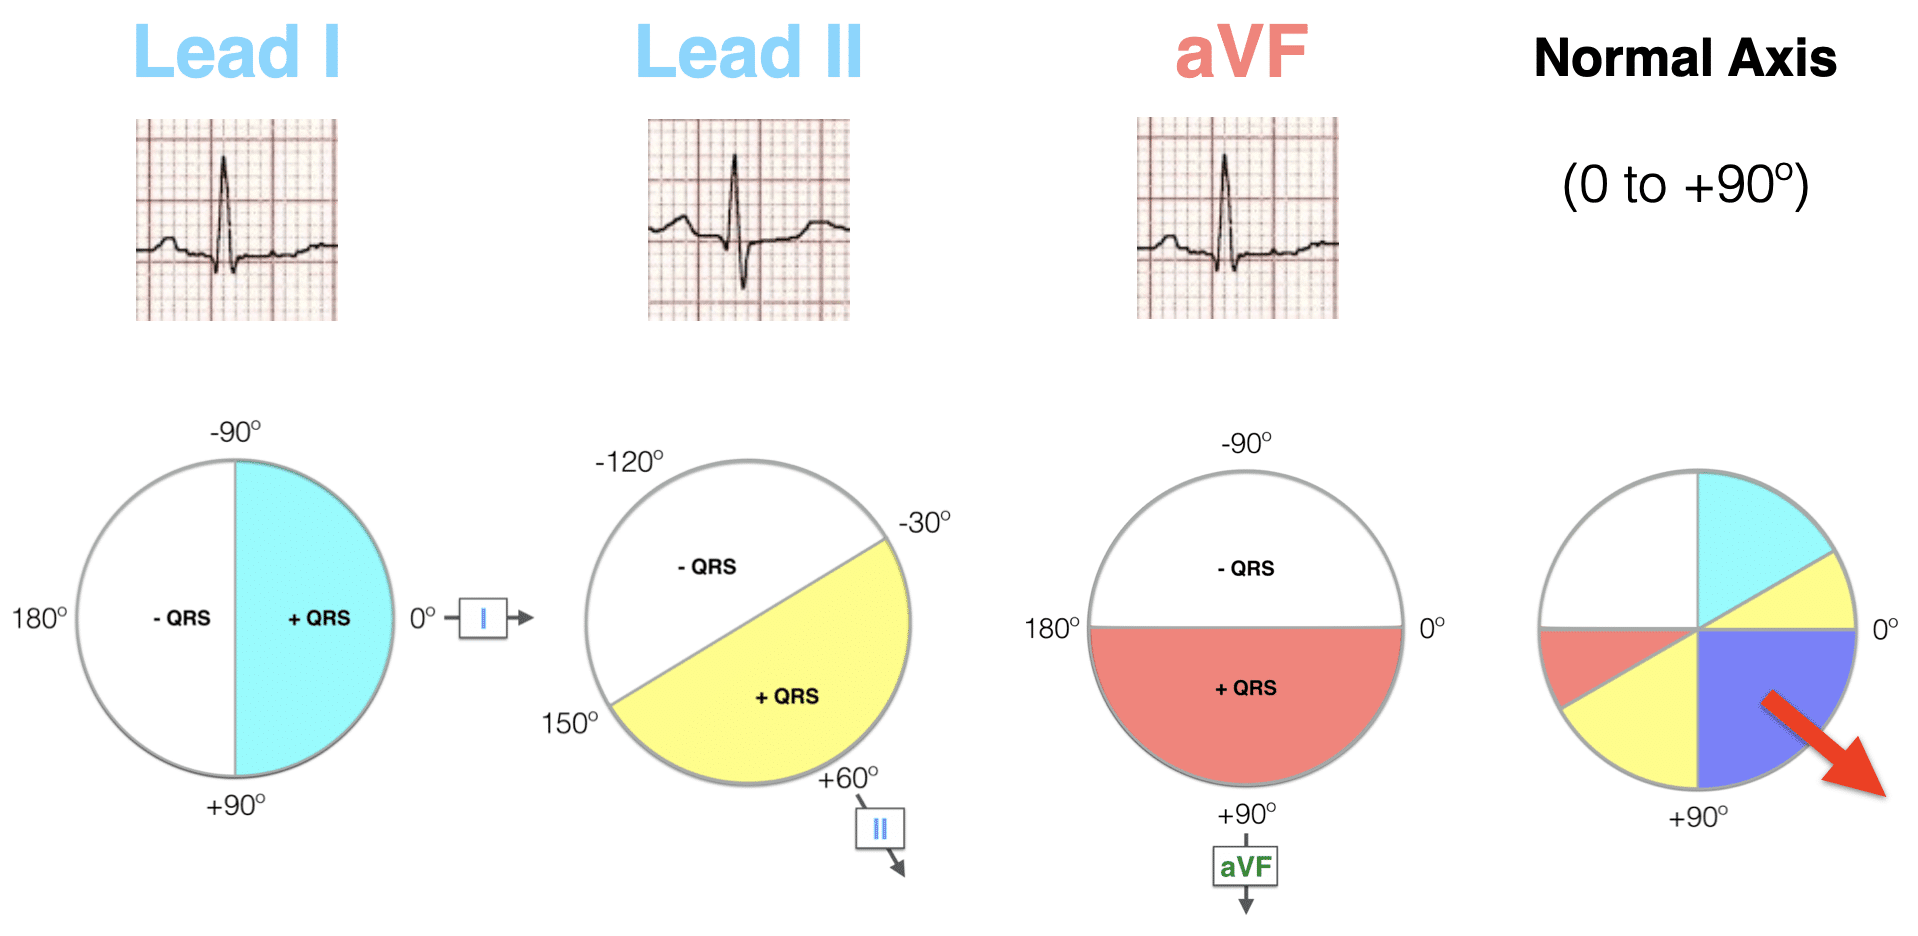
The most efficient way to estimate axis is to look at LEAD I and LEAD aVF.
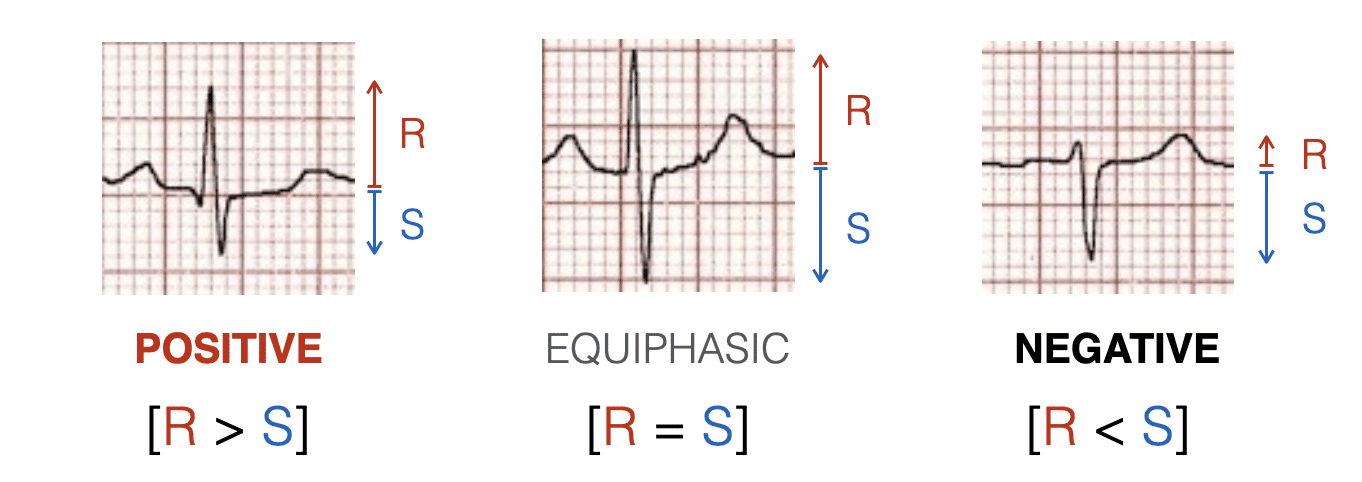
Examine the QRS complex in each lead and determine if it is Positive, Isoelectric (Equiphasic) or Negative:
- A positive QRS in Lead I puts the axis in roughly the same direction as lead I.
- A positive QRS in Lead aVF similarly aligns the axis with lead aVF.
- Combining both coloured areas – the quadrant of overlap determines the axis. So If Lead I and aVF are both positive, the axis is between 0° and +90° (i.e. normal axis).
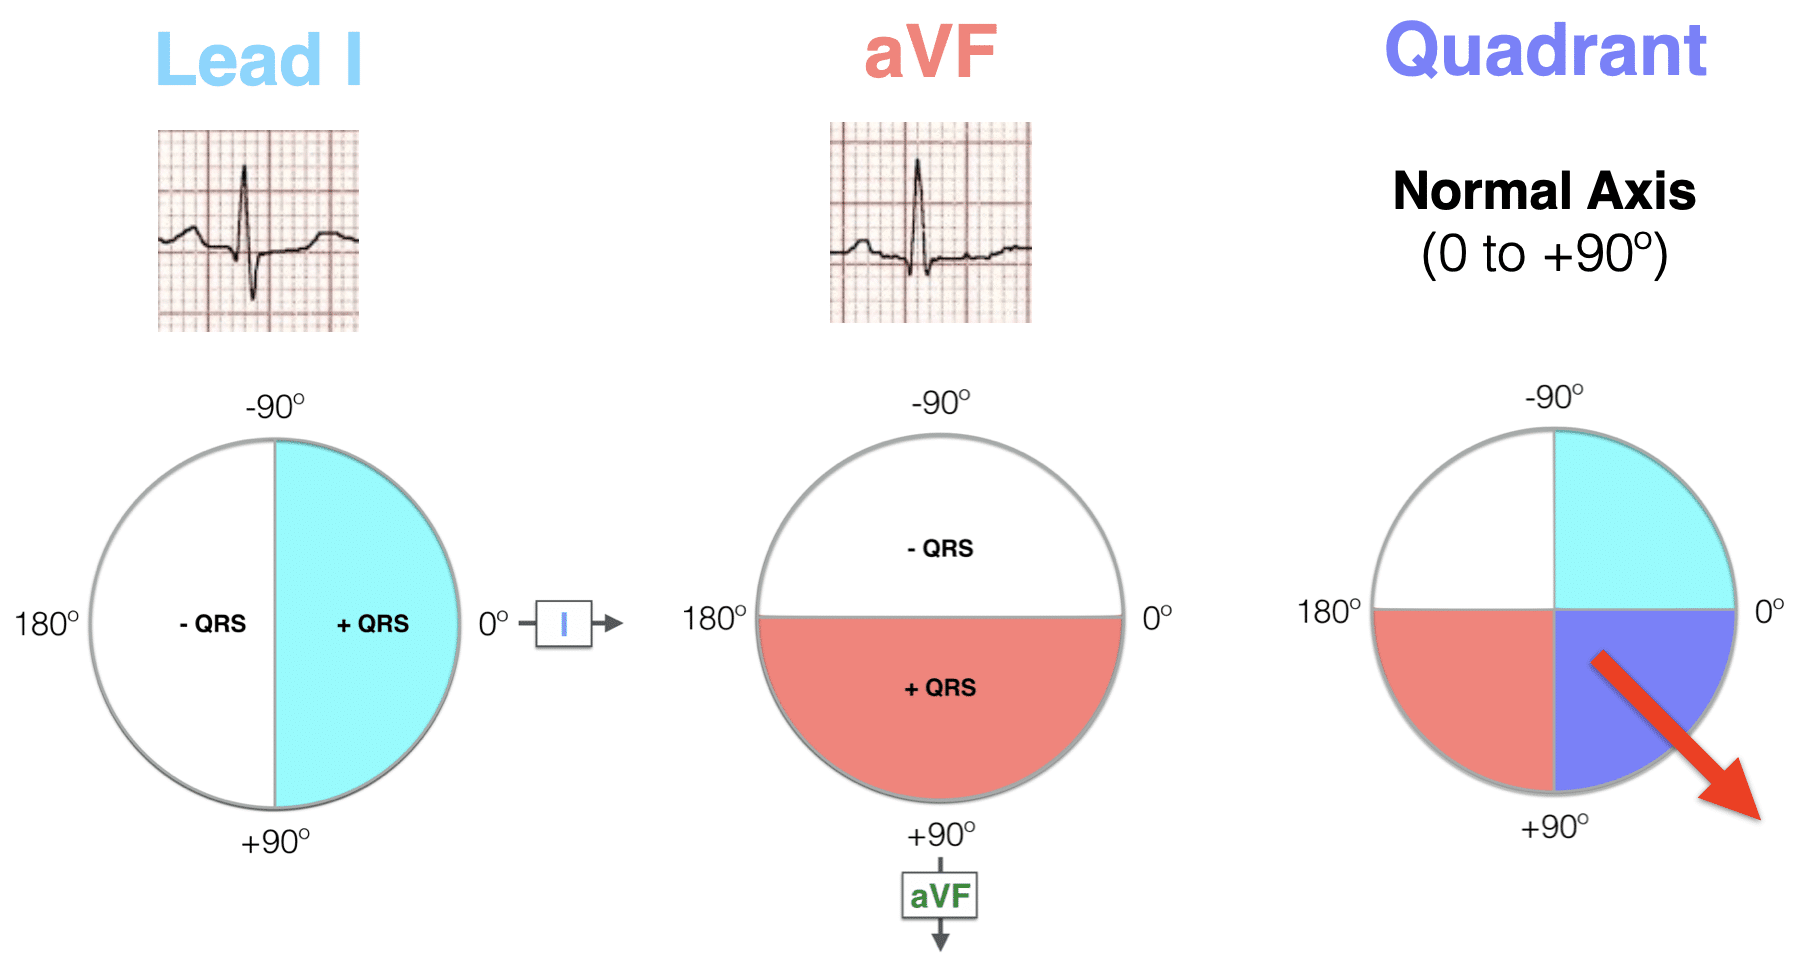
Now estimate the AXIS using the Lead I and aVF – Quadrant Method:
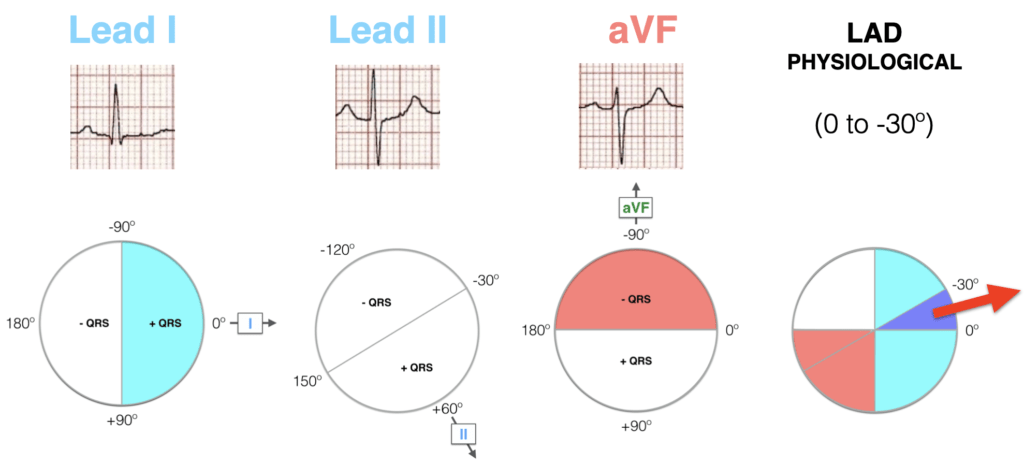
AXIS: QRS Positive Lead I – QRS Negative Lead aVF
AXIS: QRS Negative Lead I – QRS Positive Lead aVF
AXIS: QRS Negative Lead I – QRS Negative Lead aVF
Summary Table:
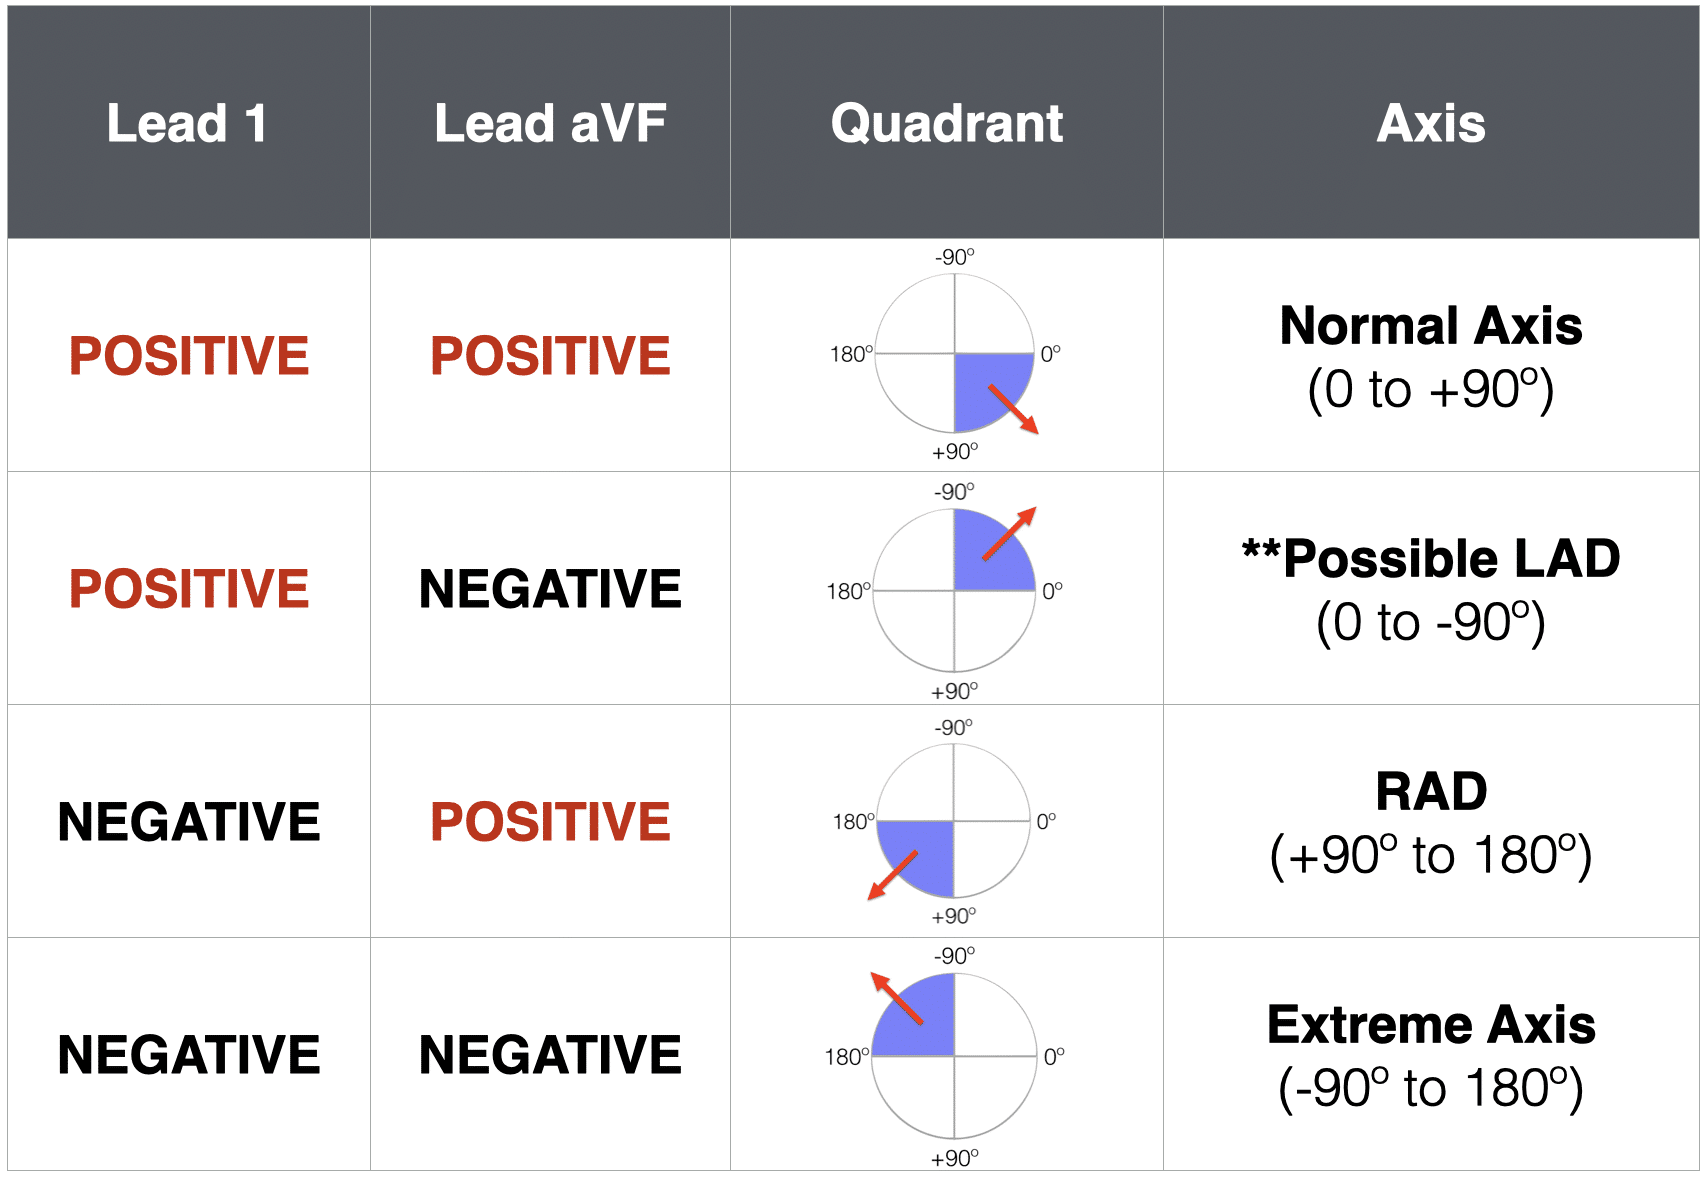
Note: **Possible LAD can be further evaluated using Lead II as detailed in method 2 below…
Method 2: Three Lead analysis – (Lead I, Lead II and aVF)
Next we add in Lead II to the analysis of Lead I and aVF
- A positive QRS in Lead I puts the axis in roughly the same direction as lead I.
- A positive QRS in Lead II similarly aligns the axis with lead II.
- We can then combine both coloured areas and the area of overlap determines the axis. So If Lead I and II are both positive, the axis is between -30° and +90° (i.e. normal axis).
- The combined evaluation of Lead I, Lead II and aVF – allows rapid and accurate QRS assessment. The addition of Lead II can help determine pathological LAD from normal axis/physiological LAD
- Note: Lead III or aVF can both be used in three lead analysis
Now estimate the AXIS using Three Lead analysis:
QRS Positive Lead I – QRS Equiphasic Lead II – QRS Negative Lead aVF
QRS Positive Lead I – QRS Negative Lead II – QRS Negative Lead aVF
QRS Negative Lead I – QRS Positive Lead II – QRS Positive Lead aVF
QRS Negative Lead I – QRS Negative Lead II – QRS Negative Lead aVF
Summary Table:

Method 3 – The Isoelectric Lead
This method allows a more precise estimation of QRS axis, using the axis diagram below.
Key Principles
- If the QRS is POSITIVE in any given lead, the axis points in roughly the same direction as this lead.
- If the QRS is NEGATIVE in any given lead, the axis points in roughly the opposite direction to this lead.
- If the QRS is ISOELECTRIC (equiphasic) in any given lead (positive deflection = negative deflection), the axis is at 90° to this lead.
Step 1: Find the isoelectric lead. The isoelectric (equiphasic) lead is the frontal lead with zero net amplitude. This can be either:
- A biphasic QRS where R wave height = Q or S wave depth.
- A flat-line QRS with no discernible features.
Step 2: Find the positive leads.
- Look for the leads with the tallest R waves (or largest R/S ratios)
Step 3: Calculate the QRS axis.
- The QRS axis is at 90° to the isoelectric lead, pointing in the direction of the positive leads.
This concept can be difficult to understand at first, and is best illustrated by some examples.
Examples
Example 1
Answer – Lead I, II, aVF
- Lead I = POSITIVE
- Lead II = POSITIVE
- aVF = POSITIVE
- This puts the axis in the quadrant between 0° and +90° – i.e. normal axis
Answer – Isoelectric Lead Method
Lead aVL is isoelectric, being biphasic with similarly sized positive and negative deflections (no need to precisely measure this).
- From the diagram above, we can see that aVL is located at -30°.
- The QRS axis must be ± 90° from lead aVL, either at +60° or -120°
- With leads I (0), II (+60) and aVF (+90) all being positive, we know that the axis must lie somewhere between 0 and +90°.
- This puts the QRS axis at +60° – i.e. normal axis
Example 2
Answer – Quadrant Method
- Lead I = NEGATIVE
- Lead II = Equiphasic
- Lead aVF = POSITIVE
- This puts the axis in the quadrant, between +90° and +180°, i.e. RAD.
Answer – Isoelectric Lead Method
- Lead II (+60°) is the isoelectric lead.
- The QRS axis must be ± 90° from lead II, at either +150° or -30°.
- The more rightward-facing leads III (+120°) and aVF (+90°) are positive, while aVL (-30°) is negative.
- This puts the QRS axis at +150°.
This is an example of right axis deviation secondary to right ventricular hypertrophy.
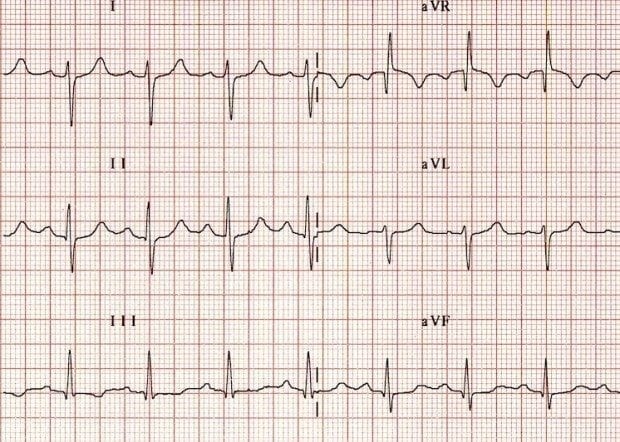
Example 3

Answer – Quadrant Method
- Lead I = POSITIVE
- Lead II = Equiphasic
- Lead aVF = NEGATIVE
- This puts the axis in the quadrant between 0° and -90°, i.e. normal or LAD.
- Lead II is neither positive nor negative (isoelectric), indicating physiological LAD.
Answer – Isoelectric Lead Method
- Lead II (+60°) is isoelectric.
- The QRS axis must be ± 90° from lead II, at either +150° or -30°.
- The more leftward-facing leads I (0°) and aVL (-30°) are positive, while lead III (+120°) is negative.
- This confirms that the axis is at -30°.
This is an example of borderline left axis deviation due to inferior MI.
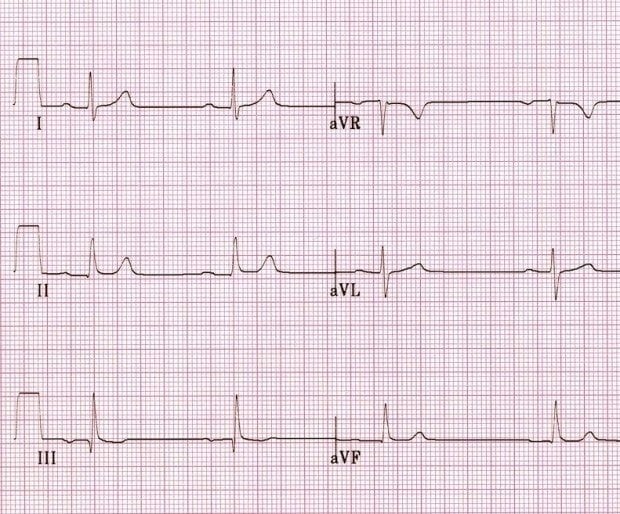
Example 4
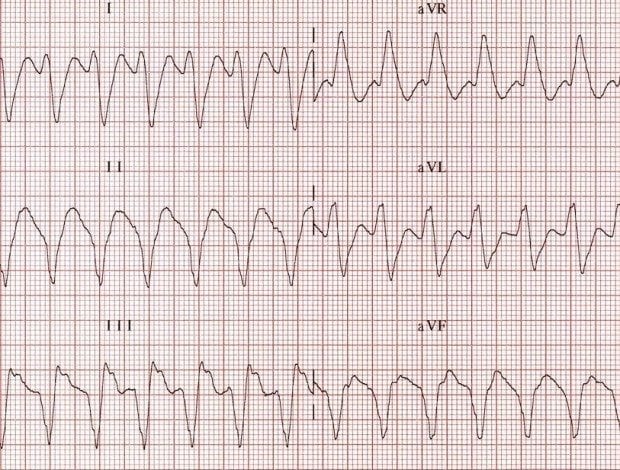
Answer – Quadrant Method
- Lead I = NEGATIVE
- Lead II = NEGATIVE
- Lead aVF = NEGATIVE
- This puts the axis in the upper right quadrant, between -90° and 180°, i.e. extreme axis deviation.
NB. The presence of a positive QRS in aVR with negative QRS in multiple leads is another clue to the presence of extreme axis deviation.
Answer – Isoelectric Lead Method
- The most isoelectric lead is aVL (-30°).
- The QRS axis must be at ± 90° from aVL at either +60° or -120°.
- Lead aVR (-150°) is positive, with lead II (+60°) negative.
- This puts the axis at -120°.
This is an example of extreme axis deviation due to ventricular tachycardia.
Example 5
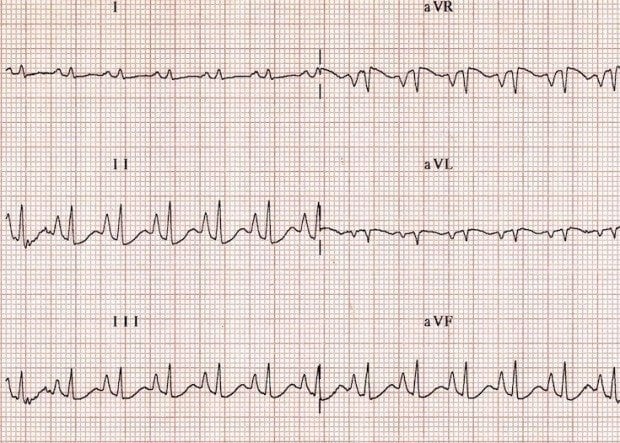
Reveal answer
- Lead I = isoelectric.
- Lead aVF = positive.
- This is the easiest axis you will ever have to calculate. It has to be at right angles to lead I and in the direction of aVF, which makes it exactly +90°!
This is referred to as a “vertical axis” and is seen in patients with emphysema who typically have a vertically orientated heart.
Causes of Axis Deviation
Right Axis Deviation
- Right ventricular hypertrophy
- Acute right ventricular strain, e.g. due to pulmonary embolism
- Lateral STEMI
- Chronic lung disease, e.g. COPD
- Hyperkalaemia
- Sodium-channel blockade, e.g. TCA poisoning
- Wolff-Parkinson-White syndrome
- Dextrocardia
- Ventricular ectopy
- Secundum ASD – rSR’ pattern
- Normal paediatric ECG
- Left posterior fascicular block – diagnosis of exclusion
- Vertically orientated heart – tall, thin patient
Left Axis Deviation
- Left ventricular hypertrophy
- Left bundle branch block
- Inferior MI
- Ventricular pacing /ectopy
- Wolff-Parkinson-White Syndrome
- Primum ASD – rSR’ pattern
- Left anterior fascicular block – diagnosis of exclusion
- Horizontally orientated heart – short, squat patient
Extreme Axis Deviation
- Ventricular rhythms – e.g.VT, AIVR, ventricular ectopy
- Hyperkalaemia
- Severe right ventricular hypertrophy
Further Reading
For a deeper understanding of axis determination, including a detailed explanation of the hexaxial reference system, check out this excellent series of articles from EMS 12-lead.
- Mastering Axis Determination: Part 1 EMS 12 lead
- Mastering Axis Determination: Part 2 EMS 12 lead
- Mastering Axis Determination: Part 3 EMS 12 lead
- Mastering Axis Determination: Part 4 EMS 12 lead
- Mastering Axis Determination: Part 5 EMS 12 lead
- Mastering Axis Determination: Part 6 EMS 12 lead
Further reading
Online
- Wiesbauer F, Kühn P. ECG Mastery: Yellow Belt online course. Understand ECG basics. Medmastery
- Wiesbauer F, Kühn P. ECG Mastery: Blue Belt online course: Become an ECG expert. Medmastery
- Kühn P, Houghton A. ECG Mastery: Black Belt Workshop. Advanced ECG interpretation. Medmastery
- Rawshani A. Clinical ECG Interpretation ECG Waves
- Smith SW. Dr Smith’s ECG blog.
- Wiesbauer F. Little Black Book of ECG Secrets. Medmastery PDF
Textbooks
- Zimmerman FH. ECG Core Curriculum. 2023
- Mattu A, Berberian J, Brady WJ. Emergency ECGs: Case-Based Review and Interpretations, 2022
- Straus DG, Schocken DD. Marriott’s Practical Electrocardiography 13e, 2021
- Brady WJ, Lipinski MJ et al. Electrocardiogram in Clinical Medicine. 1e, 2020
- Mattu A, Tabas JA, Brady WJ. Electrocardiography in Emergency, Acute, and Critical Care. 2e, 2019
- Hampton J, Adlam D. The ECG Made Practical 7e, 2019
- Kühn P, Lang C, Wiesbauer F. ECG Mastery: The Simplest Way to Learn the ECG. 2015
- Grauer K. ECG Pocket Brain (Expanded) 6e, 2014
- Surawicz B, Knilans T. Chou’s Electrocardiography in Clinical Practice: Adult and Pediatric 6e, 2008
- Chan TC. ECG in Emergency Medicine and Acute Care 1e, 2004
ECG LIBRARY
BA MA (Oxon) MBChB (Edin) FACEM FFSEM. Emergency physician, Sir Charles Gairdner Hospital. Passion for rugby; medical history; medical education; and asynchronous learning #FOAMed evangelist. Co-founder and CTO of Life in the Fast lane | On Call: Principles and Protocol 4e| Eponyms | Books |

MBBS FACEM DDU (Emergency) CCPU. Emergency Physician in Melbourne, Australia. Co-Ultrasound Lead for Emergency Medicine at The Alfred Hospital. Special interests in diagnostic and procedural ultrasound, medical education, and ECG interpretation. Editor of the LITFL ECG Library.
Hello, can I please clarify.. In the section where you are talking about the Quadrant method of calculation, you have written (just about the circular diagrams) “so if leads I and II are both positive”… should this read “so if leads I and aVF are both positive”?
Thanks for an excellent explanation of axis… such a tricky concept!
Thank you – corrected
OMG!! YOUR AMAZING. Im taking a ECG coarse for FNP school and i had no idea and was so lost about this ECG axis. I read your explanations and studied the graphs and ended up getting all the practice questions right! Thank you
That’s the most wonderful explanation that I have ever encountered. I was really confused about ECG. Thank you very much. Appreciated.
Great explanation…God bless you
Fantastic…nothing else needed
Thank you! Finally able to wrap my head around it.
This is really really a great explanation, thanks so much. Nice to be able to now analyze an ECG with more than a three lead analysis and I see the value of the precise method i.e. example 3. And now I finally understand how to do the more precise method!!!
i am overly excited i was finally able to understand cardiac axis .Thank you so much
Amazing explanation I ever read on ECG!!! Thank you Sir!!!!!
WONDERFUL EXPLANATION , EASY TO UNDERSTAND, REMEMBER AND PRACTICE
love u LITFL
Hi, thanks for this very helpful article! If leads I and II isolate the axis to between -30 and +90, then why is 3 lead analysis with aVF necessary? Because even in the case of equiphasic II as seen in physiologic LAD, wouldn’t a positive QRS in lead I still provide enough information to deduce that it is in fact physiologic LAD? Does the negative aVF provide additional usefulness?