![]()
ECG Case 122
A 72-year-old man with a history of hypertension and T2DM is brought in by ambulance with 3 hours of central chest pain.
On arrival, his pain has resolved following the administration of fentanyl and GTN en route. His pre-hospital ECG was faxed to you:
Describe and interpret this ECG
ECG ANSWER and INTERPRETATION
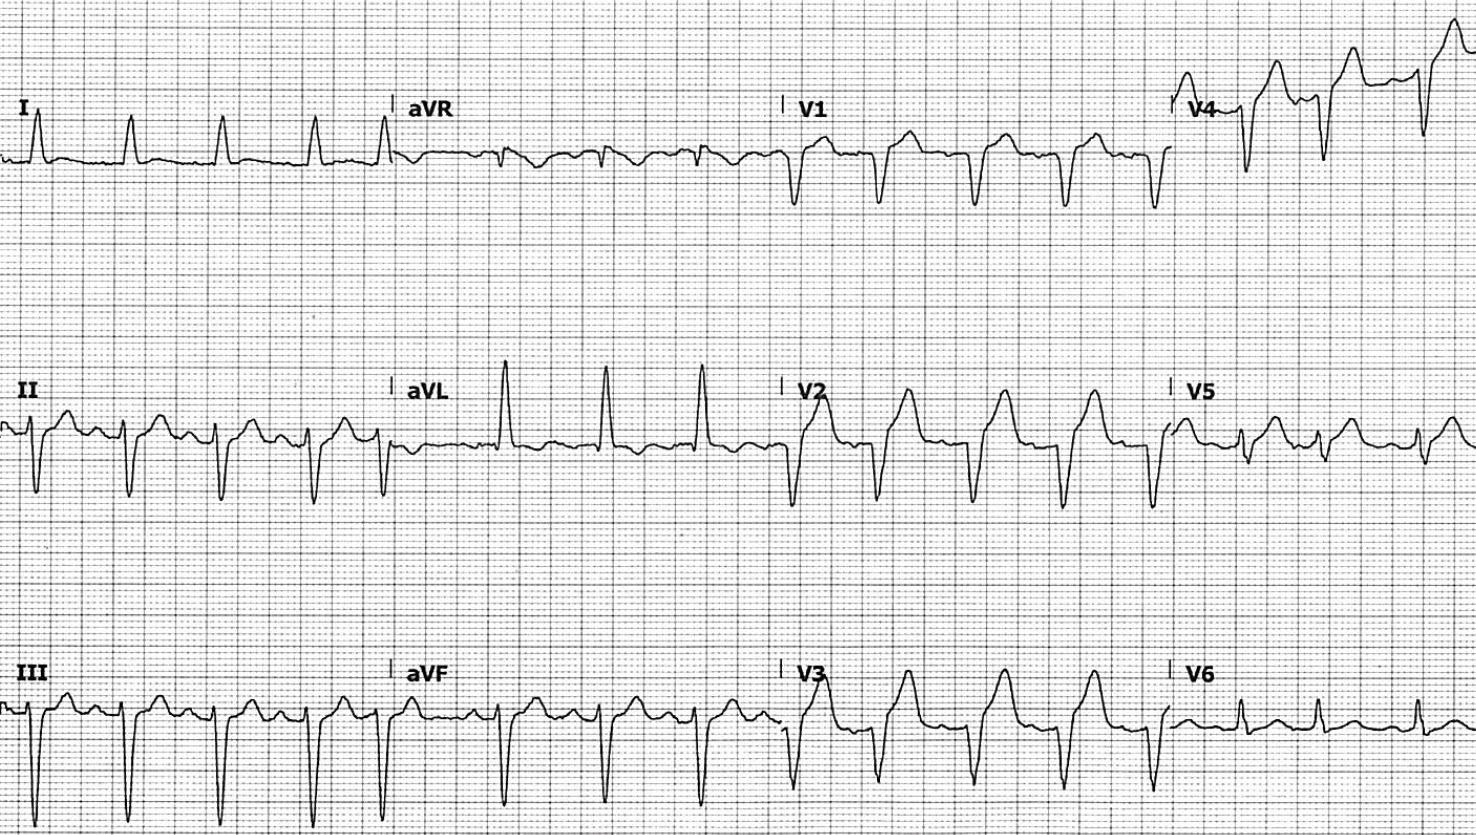
- Sinus tachycardia, rate ~100 bpm
- QRS is widened at ~120ms, and on first glance this may appear to be left bundle branch block. However, given the lack of notched R waves in lateral leads, this is more likely intraventricular conduction delay (IVCD) due to left anterior fascicular block (LAFB)
- QS complexes in leads V1-4, with hyperacute T waves in leads V2-4
- ST elevation in V2-4 appears appropriately discordant, with ST elevation measuring < 25% of the depth of the preceding S wave in V3
- Concordant ST elevation ~1mm in V5
What is the diagnosis?
Reveal answer
This ECG is diagnostic for anterior occlusion myocardial infarction (OMI), likely secondary to a lesion of the left anterior descending artery (LAD), regardless of whether QS complexes seen in anterior leads are interpreted as due to old anterior MI or LBBB.
In the context of old anterior MI with formation of QS complexes, the ratio of T-wave to QRS complex amplitude can assist with differentiating LV aneurysm versus anterior OMI:
- T-wave/QRS ratio < 0.36 in leads V1-4 favours LV aneurysm
- T-wave/QRS ratio > 0.36 in any of leads V1-4 favours anterior OMI, which is the case here
In the context of LBBB, the finding of concordant ST elevation in lead V5 is positive for both original and Smith-modified Sgarbossa criteria, indicating OMI.
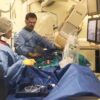
You perform a bedside echo to look for regional wall motion abnormalities consistent with ECG findings:
What is your interpretation?
Reveal answer
Parasternal short axis (PSAX) view at the level of apex
- There is regional wall motion abnormality evident, with hypokinesis of the anterior wall consistent with an anterior territory infarct

PSAX (apical level):
- Anterior LV wall
- Lateral
- Inferior
- Septal
OUTCOME
Based on these findings, the patient was taken for emergent angiography, where he was found to have a 99% sub-total occlusion of his mid-level LAD with TIMI-1 flow, as well as severe triple vessel disease. Successful PCI was performed to his LAD with resultant TIMI-3 flow.
His initial high-sensitivity troponin taken at 3.5 hours post onset of pain later returned a negative result.
CLINICAL PEARLS
Sgarbossa: smaller amplitude leads have higher diagnostic yield
The diagnosis of occlusion myocardial infarction in intraventricular conduction delay (IVCD) can be challenging. We are often drawn to leads with large QRS complexes, such as V2-3 in this patient, to determine if the degree of ST-elevation seen is “acceptable”. However, it is often leads with small QRS complexes that will manifest subtle concordant or excessively discordant ST-segment changes.
LBBB v LAFB: improving definitions
The threshold of 120ms in defining LBBB was established in 1941 via animal model experimentation limited to limb leads, and not by objective measurements in humans. At this time, other causes of QRS prolongation such as LAFB or LVH were not yet appreciated. Despite this, the 120ms cut-off point has persisted to today, often leading to an overdiagnosis of bundle branch block. Some authors advocate redefining QRS duration in LBBB to > 130-140ms given the prolonged conduction deficits seen in comparison to other causes of IVCD.
The American Heart Association recommendations include “notched or slurred R wave in leads I, aVL, V5 and V6” as part of diagnostic criteria for LBBB, largely absent in this case. The ECG morphology seen in this patient is more consistent with LAFB due to prior anterior MI.
Diagnosing acute OMI in the setting of prior MI
Over half of patients will have persisting ST-elevation in precordial leads following anterior MI. This so-called LV aneurysm morphology is associated with a small T-wave amplitude:
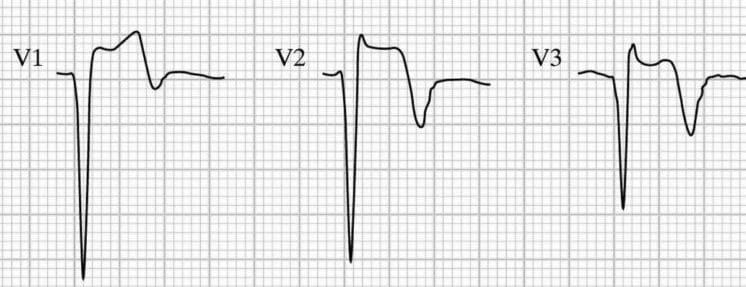
Differentiating LV aneurysm morphology from OMI can be difficult, and relies on clinical suspicion, reciprocal changes, and as discussed above, T wave amplitude relative to the QRS complex. Such reciprocal changes can be more difficult to ascertain in the context of IVCD. “Pseudonormalisation” of previously inverted T waves (such as V3 in the above example) can mask hyperacute T waves — previous ECGs are important in diagnosing OMI in these settings.
Summary
The subtlety of ECG findings in this patient, combined with his negative initial high sensitivity troponin and pain-free status on arrival, could have lead to a misdiagnosis of “unstable angina” and caused significant delays in potentially life-saving intervention.
- In IVCD, pay close attention to leads with small QRS complexes that will manifest subtle concordant or excessively discordant ST segment changes
- QRS duration > 120ms does not necessarily equal bundle branch block. Look for other features of LBBB to differentiate from LAFB and other causes of IVCD
- Hyperacute T-waves should always be interpreted in proportion to the preceding QRS amplitude
- A negative initial high-sensitivity troponin does not exclude ACS requiring emergent intervention
FURTHER READING
Related topics
- Occlusion Myocardial Infarction (OMI)
- Left Bundle Branch Block (LBBB)
- Left Anterior Fascicular Block (LAFB)
- Intraventricular Conduction Delay (QRS widening)
- Sgarbossa Criteria
- Anterior Myocardial Infarction
- Left ventricular aneurysm
Expert Review
- Smith SW, Meyers P. Differentiating LV aneurysm from acute OMI. Dr Smith’s ECG Blog. 2019 May
References
- Wilson FN. Concerning the form of the QRS deflections of the electrocardiogram in bundle branch block. J Mount Sinai Hosp NY. 1941; 8: 1110-1117.
- Strauss et al. Defining Left Bundle Branch Block in the Era of Cardiac Resynchronization Therapy. Am J Cardiology. 2011 Mar;107(6):927-934
- Klein LR, Shroff GR, Beeman W, Smith SW. Electrocardiographic criteria to differentiate acute anterior ST-elevation myocardial infarction from left ventricular aneurysm. Am J Emerg Med. 2015 Jun;33(6):786-90.
TOP 150 ECG Series

MBBS FACEM DDU (Emergency) CCPU. Emergency Physician in Melbourne, Australia. Co-Ultrasound Lead for Emergency Medicine at The Alfred Hospital. Special interests in diagnostic and procedural ultrasound, medical education, and ECG interpretation. Editor of the LITFL ECG Library.
Interventional cardiologist, ECG and hemodynamics fan. MD, Assoc. Prof. at Marmara University, Pendik T&R Hospital, Assoc. Editor at Archives of TSC, ESC National Prevention Coordinator