![]()
Digoxin Effect
Note: The presence of digoxin effect on the ECG is not a marker of digoxin toxicity. It merely indicates that the patient is taking digoxin.
ECG Features demonstrating the Digoxin Effect
Digoxin effect refers to the presence on the ECG of:
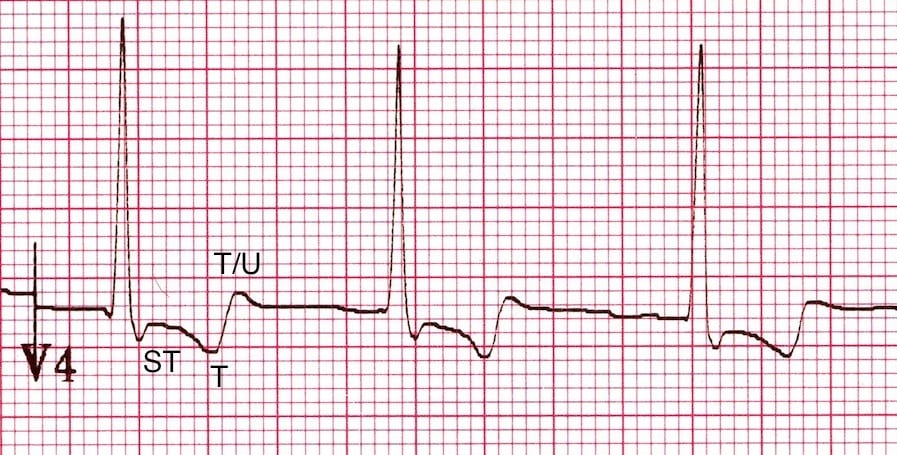
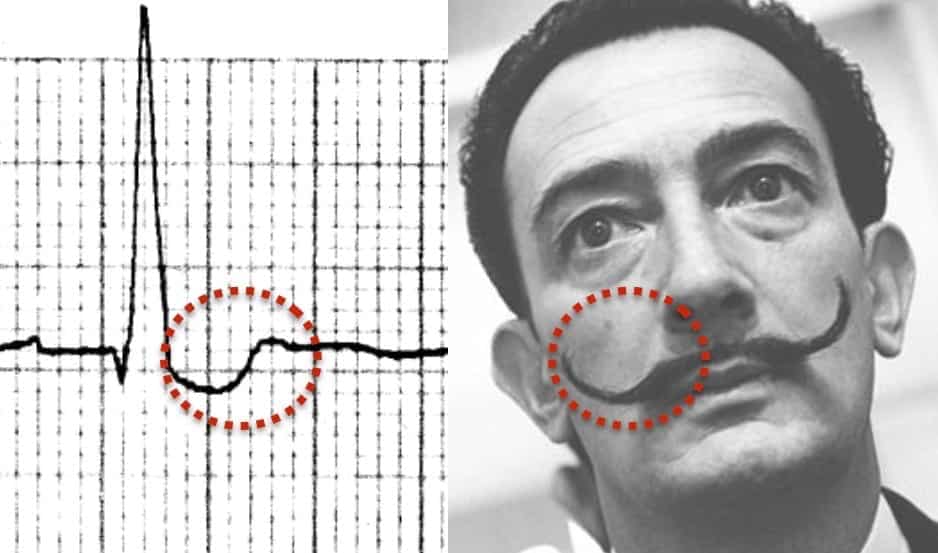
- Downsloping ST depression with a characteristic “reverse tick” or “Salvador Dali sagging” appearance
- Flattened, inverted, or biphasic T waves
- Shortened QT interval
Other Digoxin effect features
Additional ECG Features
- Mild PR interval prolongation, up to 240 ms (due to increased vagal tone)
- Prominent U waves
- Peaking of the terminal portion of the T waves
- J point depression (usually in leads with tall R waves)
QRS complex / ST segment changes
The morphology of the QRS complex / ST segment is variously described as either “slurred”, “sagging” or “scooped” and resembling either a “reverse tick”, “hockey stick” or (our personal favourite) “Salvador Dali’s moustache”!
T-wave changes
The most common T-wave abnormality is a biphasic T wave with an initial negative deflection and terminal positive deflection. This is usually seen in leads with a dominant R wave (e.g. V4-6).
The first part of the T wave is typically continuous with the depressed ST segment. The terminal positive deflection may be peaked, or have a prominent U wave superimposed upon it.
Mechanism
The ECG features of digoxin effect are seen with therapeutic doses of digoxin and are due to:
- Shortening of the atrial and ventricular refractory periods — producing a short QT interval with secondary repolarisation abnormalities affecting the ST segments, T waves and U waves
- Increased vagal effects at the AV node — causing a prolonged PR interval
Remember, the presence of digoxin effect on the ECG is not a marker of digoxin toxicity. — it merely indicates that the patient is taking digoxin!
ECG Examples
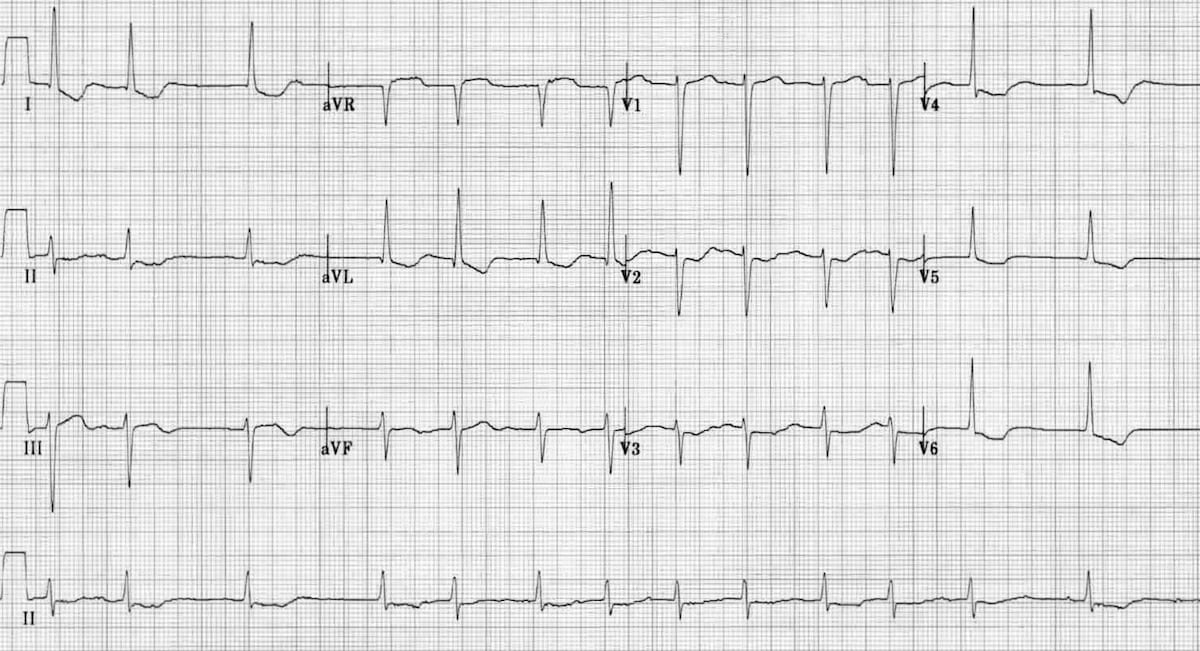
Example 1
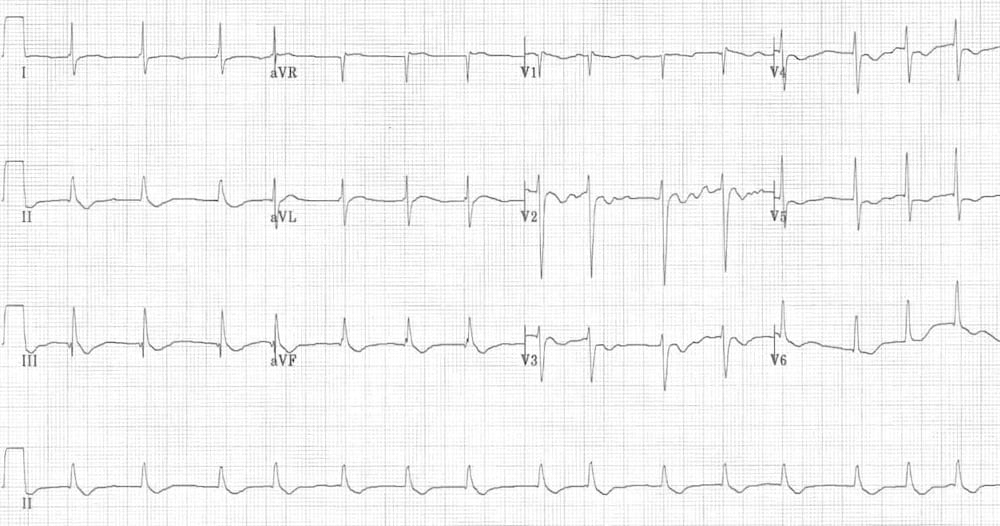
Digoxin effect:
- This is the classic picture of digoxin effect, with “sagging” ST segments and T waves taking on the appearance of “Salvador Dali’s moustache“
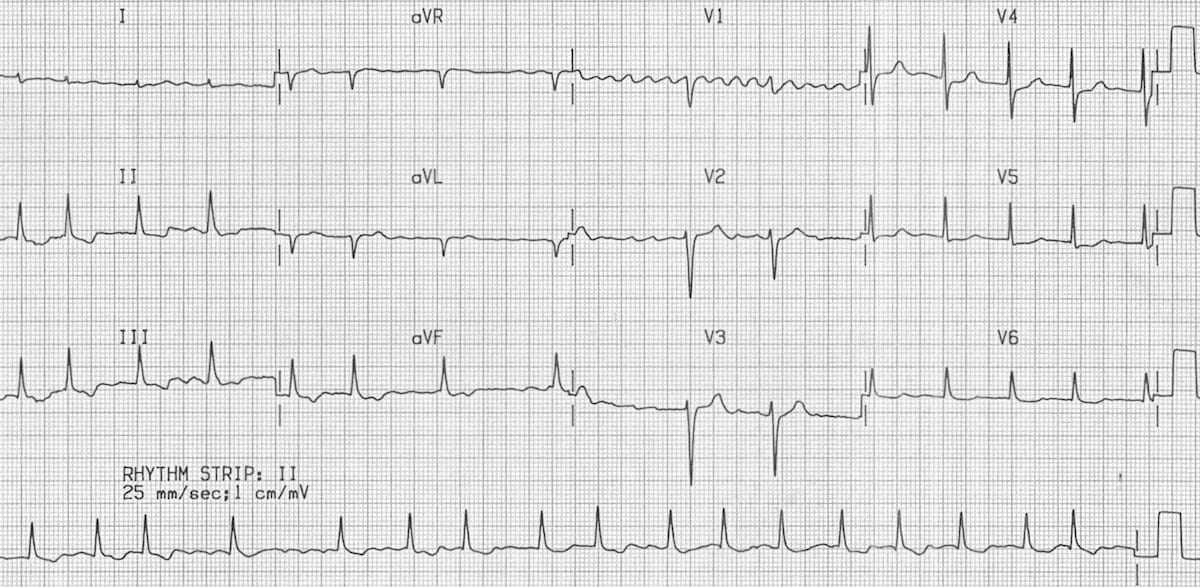
Example 2
Digoxin effect:
- Sagging ST segments are most evident in the lateral leads V4-6, I and aVL
Example 3
Digoxin effect:
- The sagging morphology is most evident in V6 and in the lead II rhythm strip
Example 4
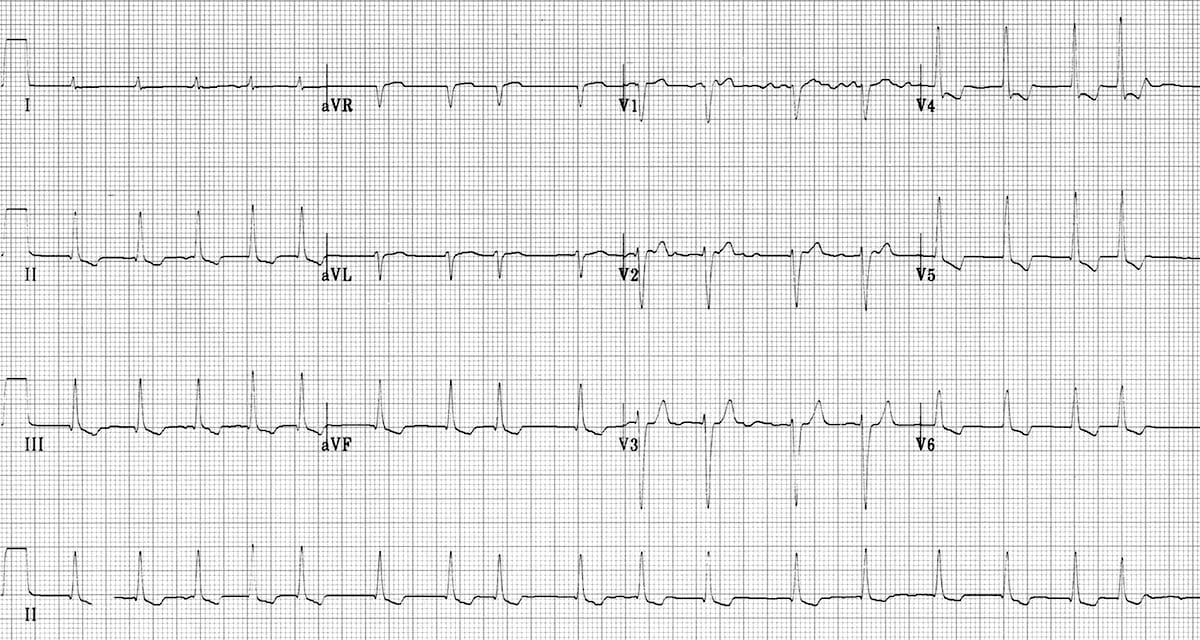
This is a slight variation on the classic digoxin pattern:
- There is still downsloping ST depression but it is slightly more angular, in comparison to the “sagging” ST segments from the previous examples
- Also, there is J-point depression in V4-6, which mimics the appearance of left ventricular hypertrophy
- The short QT interval, the “sagging” appearance in the inferior leads, and the lack of voltage criteria for LVH indicates that this is digoxin effect rather than LVH
Example 5
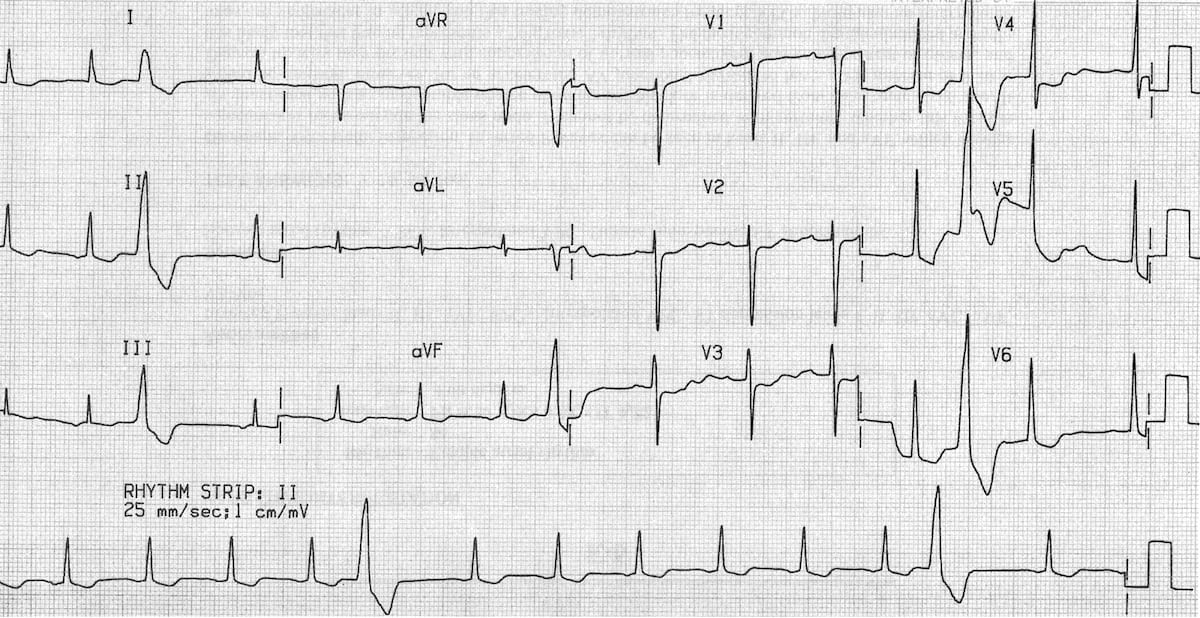
Digoxin effect:
- Sagging ST depression is clearly evident in leads I, II, III, aVF and V5-6
- Frequent premature ventricular complexes (PVCs) suggest the possibility of digoxin toxicity
Related Topics
Advanced Reading
Online
- Wiesbauer F, Kühn P. ECG Mastery: Yellow Belt online course. Understand ECG basics. Medmastery
- Wiesbauer F, Kühn P. ECG Mastery: Blue Belt online course: Become an ECG expert. Medmastery
- Kühn P, Houghton A. ECG Mastery: Black Belt Workshop. Advanced ECG interpretation. Medmastery
- Rawshani A. Clinical ECG Interpretation ECG Waves
- Smith SW. Dr Smith’s ECG blog.
- Wiesbauer F. Little Black Book of ECG Secrets. Medmastery PDF
Textbooks
- Zimmerman FH. ECG Core Curriculum. 2023
- Mattu A, Berberian J, Brady WJ. Emergency ECGs: Case-Based Review and Interpretations, 2022
- Straus DG, Schocken DD. Marriott’s Practical Electrocardiography 13e, 2021
- Brady WJ, Lipinski MJ et al. Electrocardiogram in Clinical Medicine. 1e, 2020
- Mattu A, Tabas JA, Brady WJ. Electrocardiography in Emergency, Acute, and Critical Care. 2e, 2019
- Hampton J, Adlam D. The ECG Made Practical 7e, 2019
- Kühn P, Lang C, Wiesbauer F. ECG Mastery: The Simplest Way to Learn the ECG. 2015
- Grauer K. ECG Pocket Brain (Expanded) 6e, 2014
- Surawicz B, Knilans T. Chou’s Electrocardiography in Clinical Practice: Adult and Pediatric 6e, 2008
- Chan TC. ECG in Emergency Medicine and Acute Care 1e, 2004
LITFL Further Reading
- ECG Library Basics – Waves, Intervals, Segments and Clinical Interpretation
- ECG A to Z by diagnosis – ECG interpretation in clinical context
- ECG Exigency and Cardiovascular Curveball – ECG Clinical Cases
- 100 ECG Quiz – Self-assessment tool for examination practice
- ECG Reference SITES and BOOKS – the best of the rest
ECG LIBRARY
Emergency Physician in Prehospital and Retrieval Medicine in Sydney, Australia. He has a passion for ECG interpretation and medical education | ECG Library |