
![]()
QT Interval
Definition
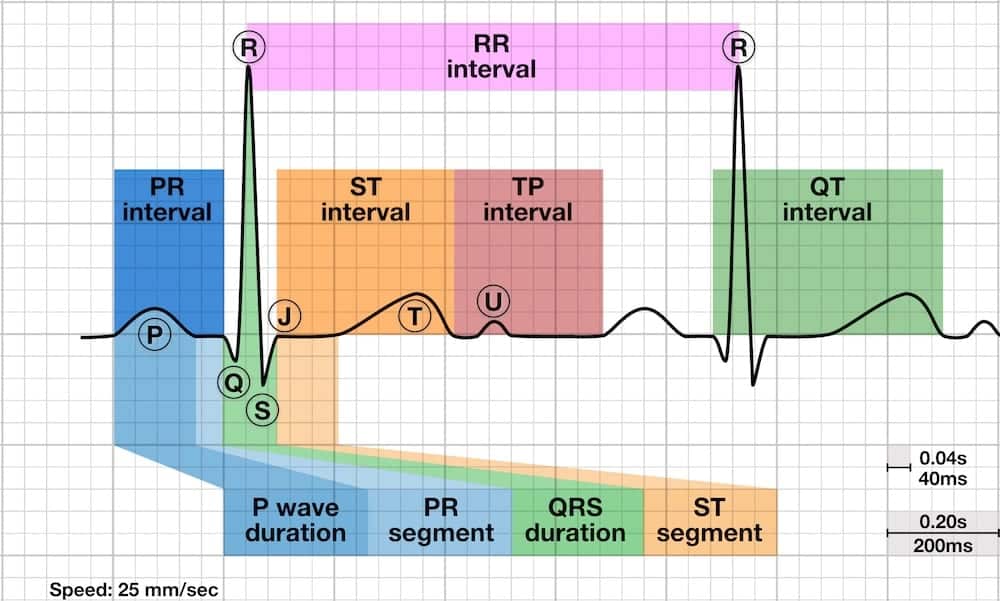
- Time from the start of the Q wave to the end of the T wave
- Represents time taken for ventricular depolarisation and repolarisation, effectively the period of ventricular systole from ventricular isovolumetric contraction to isovolumetric relaxation
The QT interval is inversely proportional to heart rate:
- The QT interval shortens at faster heart rates
- The QT interval lengthens at slower heart rates
- An abnormally prolonged QT is associated with an increased risk of ventricular arrhythmias, especially Torsades de Pointes
- Congenital short QT syndrome has been found to be associated with an increased risk of paroxysmal atrial and ventricular fibrillation and sudden cardiac death
How to measure the QT interval
- The QT interval is usually measured in either lead II or V5-6, however the lead with the longest measurement should be used
- Several successive beats should be measured, with the maximum interval taken
- Large U waves (> 1mm) that are fused to the T wave should be included in the measurement
- Smaller U waves and those that are separate from the T wave should be excluded
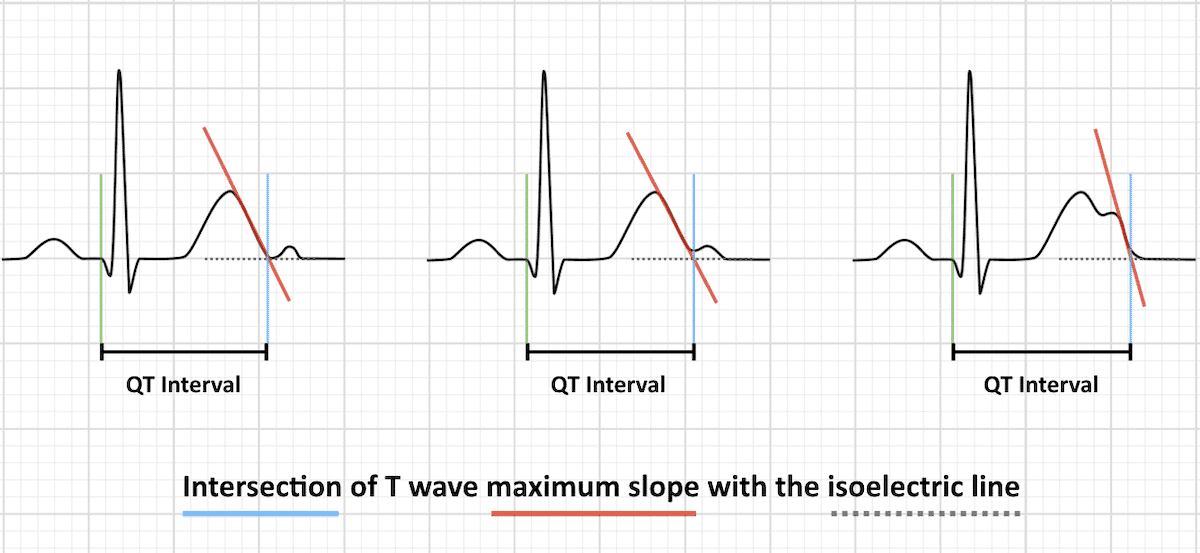
- The maximum slope intercept method is used to define the end of the T wave (see below)
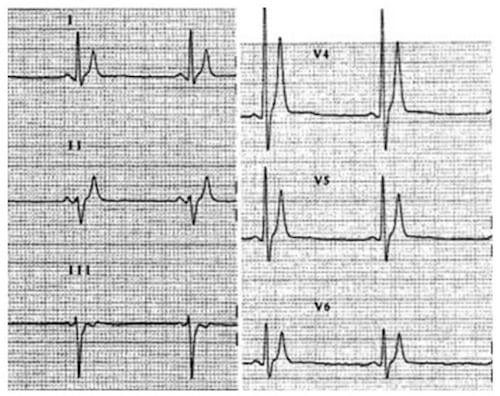
Right: Large U waves that are fused to the T wave should be included in measurements
The QT interval is defined from the beginning of the QRS complex to the end of the T wave. The maximum slope intercept method defines the end of the T wave as the intercept between the isoelectric line with the tangent drawn through the maximum down slope of the T wave (left).
When notched T waves are present (right), the QT interval is measured from the beginning of the QRS complex to the intersection point between the isoelectric line and the tangent drawn from the maximum down slope of the second notch.
Corrected QT interval (QTc)
- The corrected QT interval (QTc) estimates the QT interval at a standard heart rate of 60 bpm
- This allows comparison of QT values over time at different heart rates and improves detection of patients at increased risk of arrhythmias
There are multiple formulas used to estimate QTc. It is not clear which formula is the most useful:
- Bazett formula: QTC = QT / √ RR
- Fridericia formula: QTC = QT / RR 1/3
- Framingham formula: QTC = QT + 0.154 (1 – RR)
- Hodges formula: QTC = QT + 1.75 (heart rate – 60)
Note: The RR interval is given in seconds (RR interval = 60 / heart rate).
- Bazett and Fridericia are logarithmic corrections whereas Hodges and Framingham are linear correction formulae
- Henry Cuthbert Bazett derived his formula in 1920. Bazett formula is the most commonly used due to its simplicity. It over-corrects at heart rates > 100 bpm and under-corrects at heart rates < 60 bpm, but provides an adequate correction for heart rates ranging from 60 – 100 bpm
- Louis Sigurd Fridericia derived his formula in 1920 from 50 healthy individuals aged 3 to 81 years old. Fredericia formula is the observed QT interval divided by cube root of RR interval, in seconds
- Charbit B et al studied 108 patients and found that automatic QT correction using Bazett formula had a sensitivity for detection of QT prolongation of 54% while automatic QT correction using Fridericia formula had 100% sensitivity
- At heart rates outside of the 60 – 100 bpm range, the Fridericia or Framingham corrections are more accurate and should be used instead [Framingham heart study, 1992]
- If an ECG is fortuitously captured while the patient’s heart rate is 60 bpm, the absolute QT interval should be used instead!
Fortunately, there are now multiple phone apps that will calculate QTc for you, for example MDCalc.com has a quick and easy QTc calculator that is free to use.
Normal QTc values
- QTc is prolonged if > 440ms in men or > 460ms in women
- QTc > 500 is associated with an increased risk of torsades de pointes
- QTc is abnormally short if < 350ms
- A useful rule of thumb is that a normal QT is less than half the preceding RR interval
Causes of a prolonged QTc (>440ms)
- Hypokalaemia
- Hypomagnesaemia
- Hypocalcaemia
- Hypothermia
- Myocardial ischemia
- ROSC Post-cardiac arrest
- Raised intracranial pressure
- Congenital long QT syndrome
- Medications/Drugs
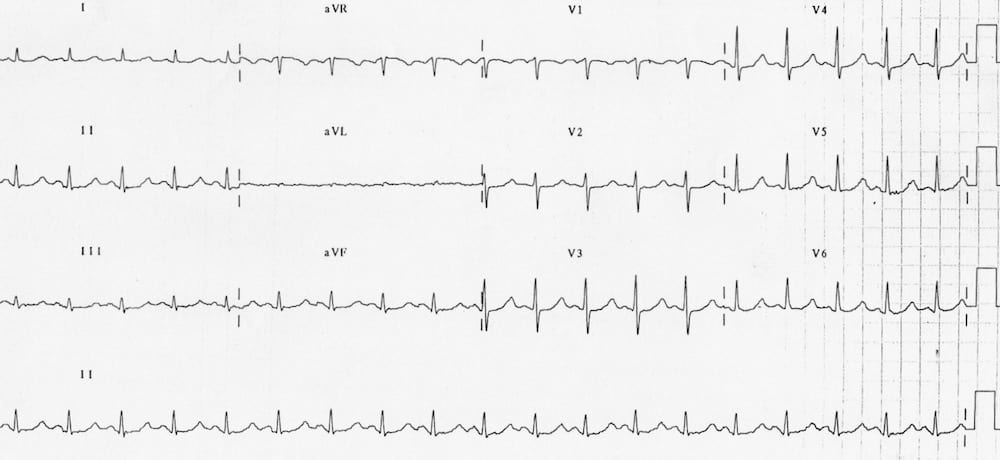
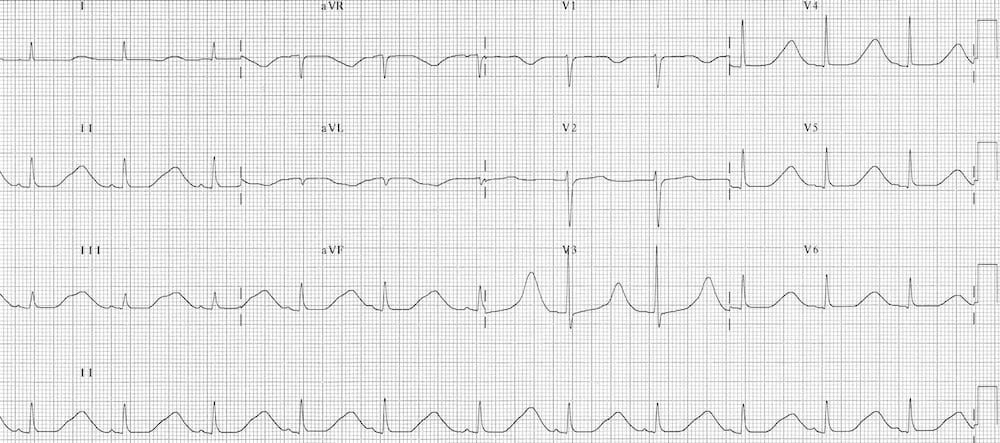
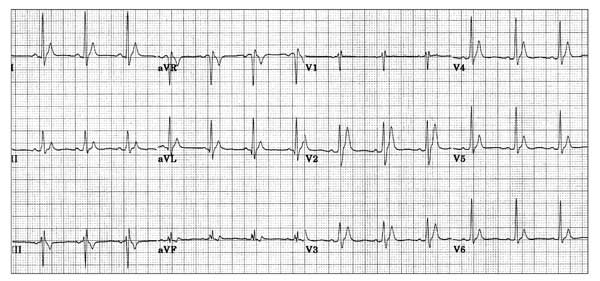
Hypokalaemia
- Apparent QTc 500ms
- There are prominent U waves in precordial leads
- This patient had a K of 1.9
- Hypokalaemia causes apparent QTc prolongation in the limb leads (due to T-U fusion) with prominent U waves in the precordial leads.
Hypomagnesaemia
- QTc 510 ms secondary to hypomagnesaemia
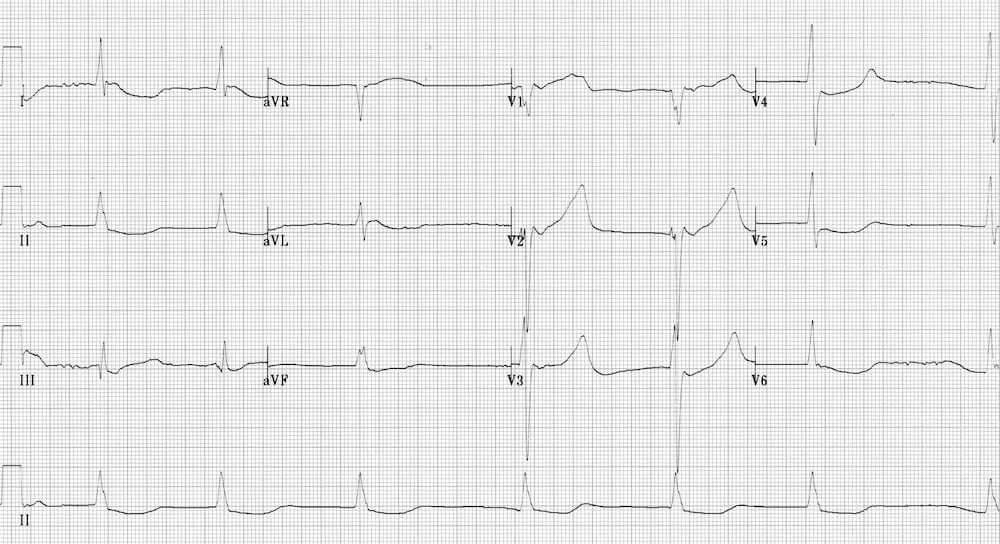
Hypocalcaemia
- QTc 510ms due to hypocalcaemia
- Hypocalcaemia typically prolongs the ST segment, leaving the T wave unchanged
Hypothermia
- QTc 620 ms due to severe hypothermia
- Severe hypothermia can cause marked QTc prolongation, often in association with bradyarrhythmias (especially slow AF), Osborn waves and shivering artefact
Myocardial Ischaemia
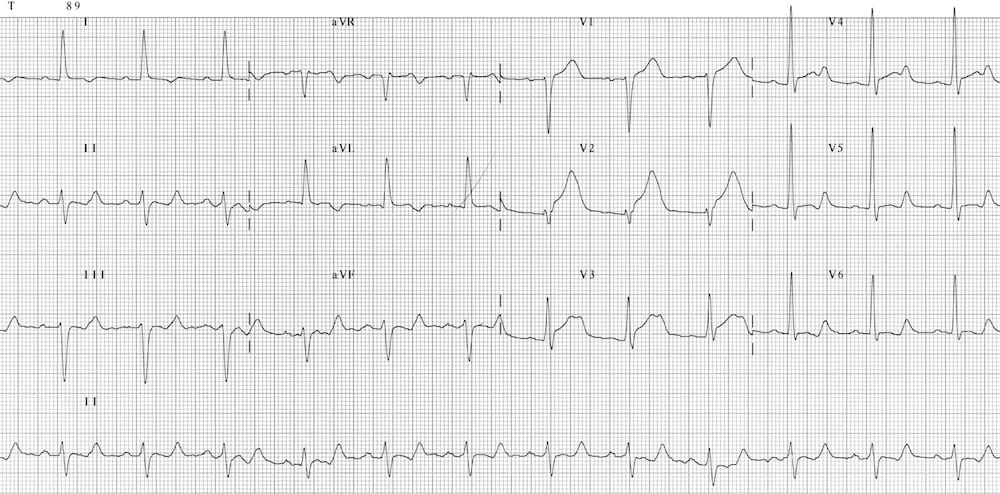
- QTc 495 ms due to hyperacute MI
- Myocardial ischemia tends to produce a modest increase in the QTc, in the 450-500 ms range
- This may be useful in distinguishing hyperacute MI from benign early repolarization (both may produce similar hyperacute T waves, but benign early repolarisation (BER) will usually have a normal QTc)
Raised ICP
- QTc 630ms with widespread T wave inversion due to subarachnoid haemorrhage
- A sudden rise in intracranial pressure (e.g. due to subarachnoid haemorrhage) may produce characteristic T wave changes (‘cerebral T waves’): widespread, deep T wave inversions with a prolonged QTc
Congenital Long QT Syndrome

- QTc 550ms due to congenital long QT syndrome
- There are several congenital disorders of ion channels that produce a long QT syndrome and are associated with increased risk of torsades de pointes and sudden cardiac death
Causes of a short QTc (<350ms)
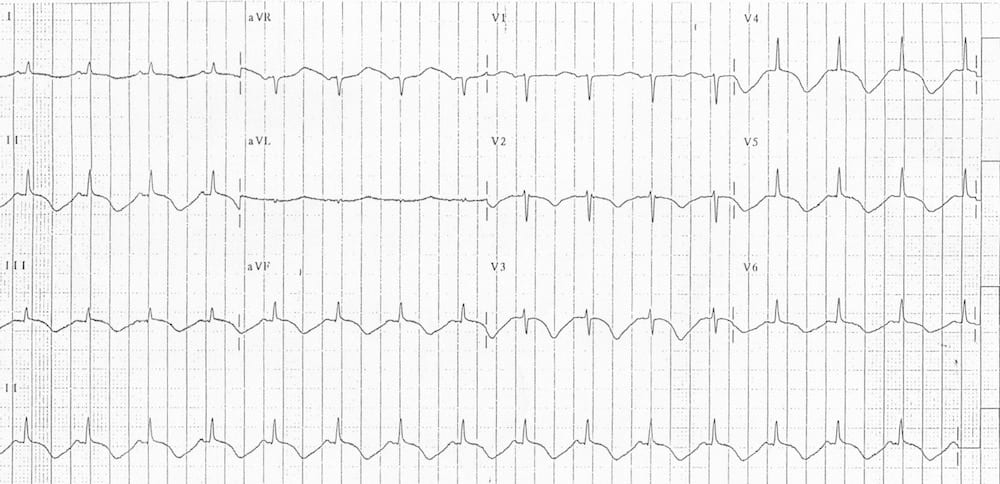
Hypercalcaemia

- Marked shortening of the QTc (260ms) due to hypercalcaemia
- Hypercalcaemia leads to shortening of the ST segment and may be associated with the appearance of Osborne waves
Congenital short QT syndrome
- Very short QTc (280ms) with tall, peaked T waves due to congenital short QT syndrome
- Congenital short QT syndrome (SQTS) is an autosomal dominant inherited disorder of potassium channels associated with an increased risk of paroxysmal atrial and ventricular fibrillation and sudden cardiac death
- The main ECG changes are very short QTc (<300-350ms) with tall, peaked T waves
Short QT syndrome may be suggested by the presence of:
- Lone atrial fibrillation in young adults
- Family member with a short QT interval
- Family history of sudden cardiac death
- ECG showing QTc < 350 ms with tall, peaked T waves
- Failure of the QT interval to increase as the heart rate slows
Digoxin

Digoxin produces a relative shortening of the QT interval, along with downward sloping ST segment depression in the lateral leads (‘reverse tick’ appearance), widespread T-wave flattening and inversion, and a multitude of arrhythmias (ventricular ectopy, atrial tachycardia with block, sinus bradycardia, regularized AF, any type of AV block).
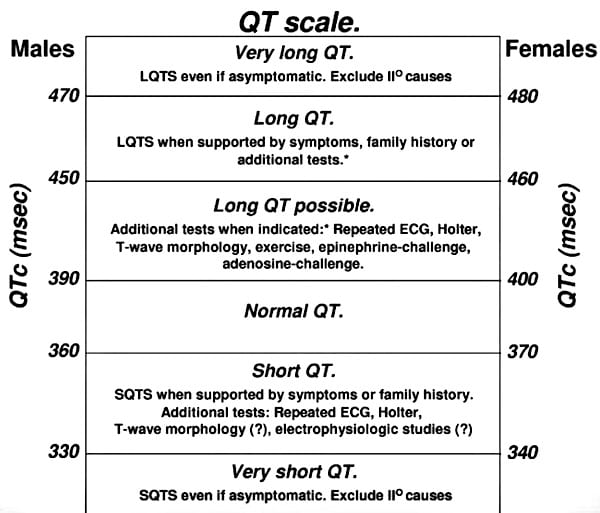
QT interval scale
Viskin (2009) proposes the use of a ‘QT interval scale’ to aid diagnosis of patients with short and long QT syndromes (once reversible causes have been excluded):
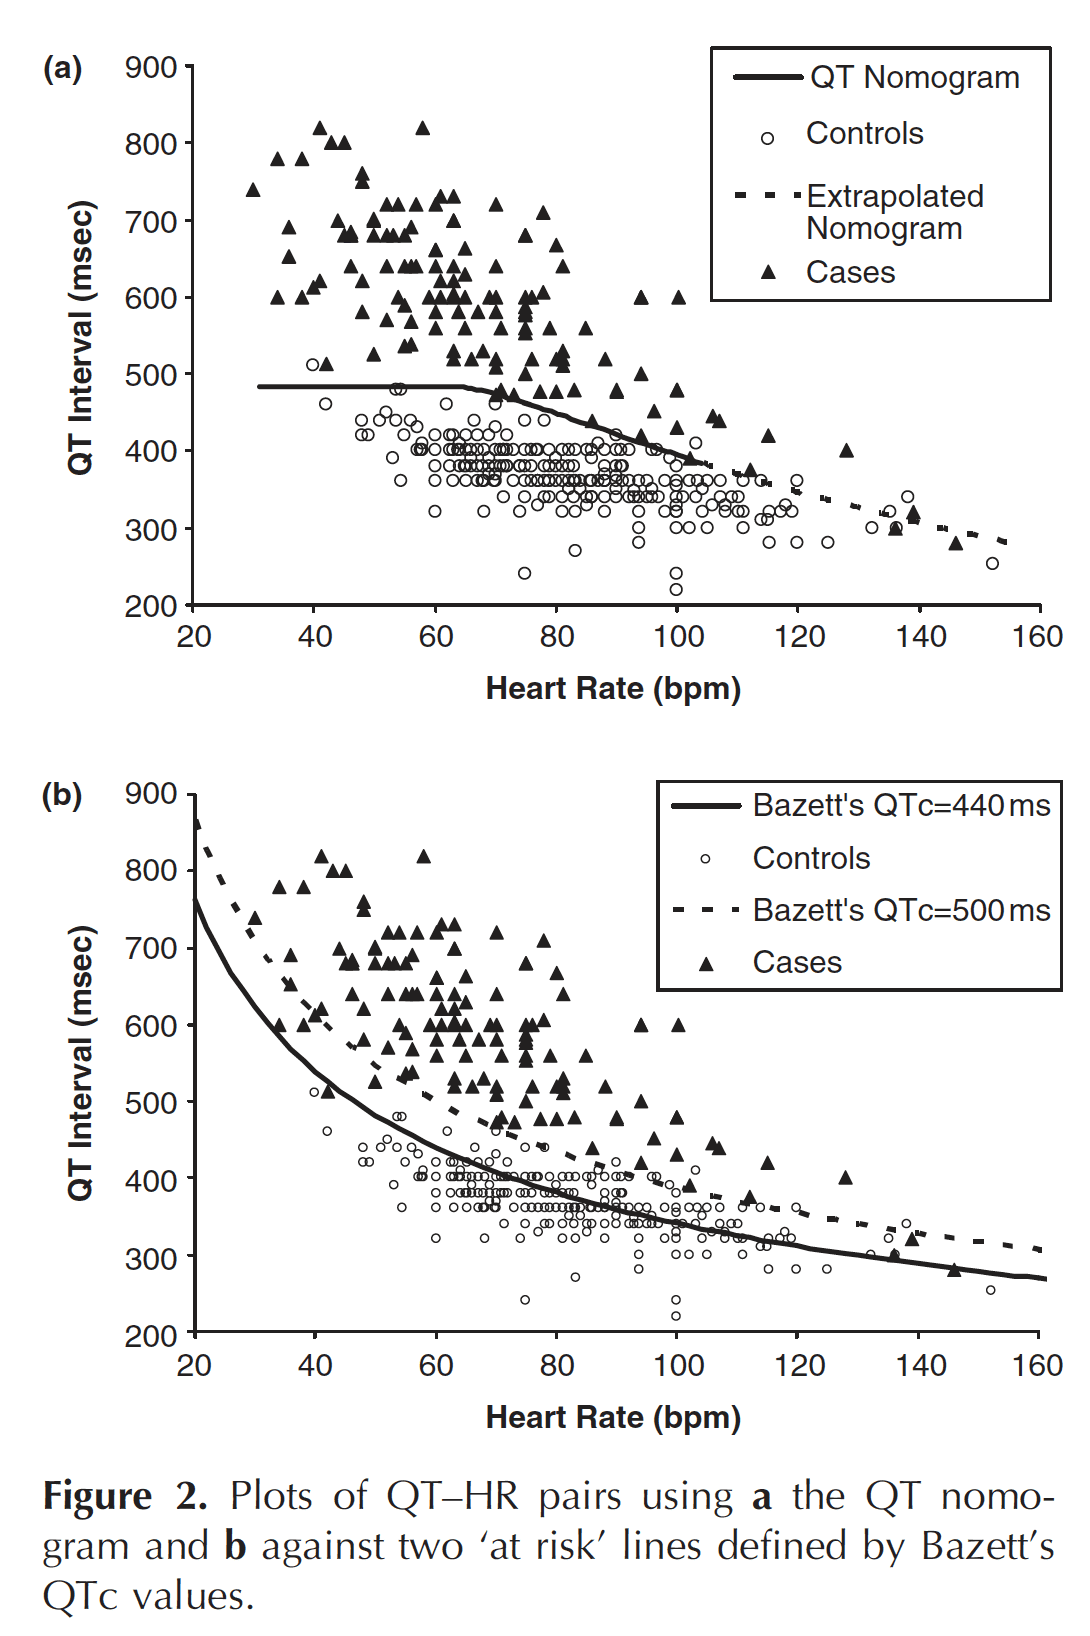
Drug-induced QT-Prolongation and Torsades
In the context of acute poisoning with QT-prolonging agents, the risk of TdP is better described by the absolute rather than corrected QT.
- More precisely, the risk of TdP is determined by considering both the absolute QT interval and the simultaneous heart rate (i.e. on the same ECG tracing).
- These values are then plotted on the QT nomogram (developed by Chan et al) to determine whether the patient is at risk of TdP.
- The QT nomogram is a clinically relevant risk assessment tool that predicts arrhythmogenic risk for drug-induced QT prolongation can be used for risk stratification
- A QT interval-heart rate pair that plots above the line indicates the patient is at risk of TdP.
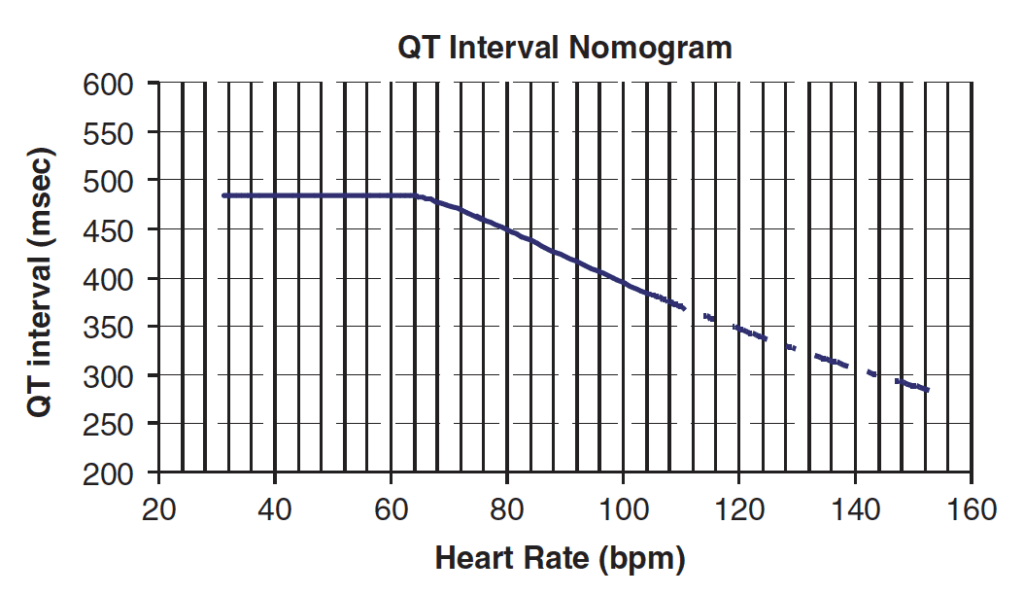
Chan et al plots of QT-HR pairs
References
- Sagie A, Larson MG, Goldberg RJ, Bengtson JR, Levy D. An improved method for adjusting the QT interval for heart rate (the Framingham Heart Study). Am J Cardiol. 1992 Sep 15;70(7):797-801
- Gaita F, Giustetto C, Bianchi F et al. Short QT Syndrome: a familial cause of sudden death. Circulation. 2003: 108: 965-70.
- Chan A, Isbister GK, Kirkpatrick CMJ, Dufful SB. Drug-induced QT prolongation and torsades de pointes: evaluation of a QT nomogram. QJM: An International Journal of Medicine. 2007. 100(10)609-615
- Taggart NW, Haglund CM, Tester DJ, Ackerman MJ. Diagnostic miscues in congenital long-QT syndrome. Circulation. 2007 May 22;115(20):2613-20
- Vetter VL. Clues or miscues? How to make the right interpretation and correctly diagnose long-QT syndrome. Circulation 2007;115:2595–8.
- Viskin S. The QT interval: too long, too short or just right. Heart Rhythm. 2009 May;6(5):711-5. Epub 2009 Mar 3
ECG Library Basics
- P Wave
- PR Interval
- PR Segment
- Q Wave
- QRS Segment
- QT Interval
- J Point
Advanced Reading
Online
- Wiesbauer F, Kühn P. ECG Mastery: Yellow Belt online course. Understand ECG basics. Medmastery
- Wiesbauer F, Kühn P. ECG Mastery: Blue Belt online course: Become an ECG expert. Medmastery
- Kühn P, Houghton A. ECG Mastery: Black Belt Workshop. Advanced ECG interpretation. Medmastery
- Rawshani A. Clinical ECG Interpretation ECG Waves
- Smith SW. Dr Smith’s ECG blog.
- Wiesbauer F. Little Black Book of ECG Secrets. Medmastery PDF
Textbooks
- Zimmerman FH. ECG Core Curriculum. 2023
- Mattu A, Berberian J, Brady WJ. Emergency ECGs: Case-Based Review and Interpretations, 2022
- Straus DG, Schocken DD. Marriott’s Practical Electrocardiography 13e, 2021
- Brady WJ, Lipinski MJ et al. Electrocardiogram in Clinical Medicine. 1e, 2020
- Mattu A, Tabas JA, Brady WJ. Electrocardiography in Emergency, Acute, and Critical Care. 2e, 2019
- Hampton J, Adlam D. The ECG Made Practical 7e, 2019
- Kühn P, Lang C, Wiesbauer F. ECG Mastery: The Simplest Way to Learn the ECG. 2015
- Grauer K. ECG Pocket Brain (Expanded) 6e, 2014
- Surawicz B, Knilans T. Chou’s Electrocardiography in Clinical Practice: Adult and Pediatric 6e, 2008
- Chan TC. ECG in Emergency Medicine and Acute Care 1e, 2004
LITFL Further Reading
- ECG Library Basics – Waves, Intervals, Segments and Clinical Interpretation
- ECG A to Z by diagnosis – ECG interpretation in clinical context
- ECG Exigency and Cardiovascular Curveball – ECG Clinical Cases
- 100 ECG Quiz – Self-assessment tool for examination practice
- ECG Reference SITES and BOOKS – the best of the rest
ECG LIBRARY
Emergency Physician in Prehospital and Retrieval Medicine in Sydney, Australia. He has a passion for ECG interpretation and medical education | ECG Library |

MBBS FACEM DDU (Emergency) CCPU. Emergency Physician in Melbourne, Australia. Co-Ultrasound Lead for Emergency Medicine at The Alfred Hospital. Special interests in diagnostic and procedural ultrasound, medical education, and ECG interpretation. Editor of the LITFL ECG Library.