![]()
ECG Case 070
Elderly patient presenting with sudden onset of chest pain and shortness of breath. Hypoxic (SaO2 82% RA) and hypotensive (80/50). Describe and interpret his ECG
Describe and interpret this ECG
ECG ANSWER and INTERPRETATION
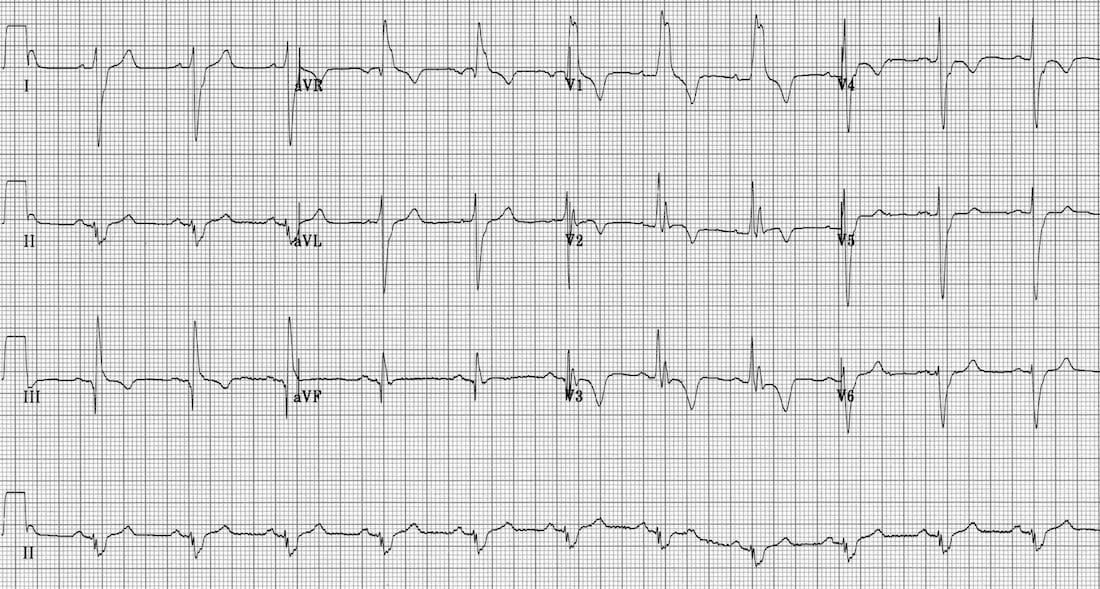
There are multiple features suggestive of right ventricular hypertrophy or RV strain:
- Right axis deviation
- Dominant R wave in V1
- Right bundle branch block
- Right ventricular strain pattern — T wave inversions in V1-4, lead III
- SI QIII TIII pattern
- Clockwise rotation of the heart, with a persistent S wave in V6
Given the clinical history, the most likely scenario is acute right heart strain due to massive pulmonary embolism.
A similar ECG pattern may also be seen with chronic cor pulmonale, pulmonary hypertension or RV hypertrophy (e.g. due to congenital heart disease).
CLINICAL PEARLS
ECG changes in pulmonary embolism include:
- Sinus tachycardia – the most common abnormality; seen in 44% of patients.
- Complete or incomplete RBBB – associated with increased mortality; seen in 18% of patients.
- Right ventricular strain pattern – T wave inversions in the right precordial leads (V1-4) ± the inferior leads (II, III, aVF). This pattern is seen in up to 34% of patients and is associated with high pulmonary artery pressures.
- Right axis deviation – seen in 16% of patients. Extreme right axis deviation may occur, with axis between zero and -90 degrees, giving the appearance of left axis deviation (“pseudo left axis”).
- Dominant R wave in V1 – a manifestation of acute right ventricular dilatation.
- Right atrial enlargement (P pulmonale) – peaked P wave in lead II > 2.5 mm in height. Seen in 9% of patients.
- SI QIII TIII pattern – deep S wave in lead I, Q wave in III, inverted T wave in III. This “classic” finding is neither sensitive nor specific for pulmonary embolism; found in only 20% of patients with PE.
- Clockwise rotation – shift of the R/S transition point towards V6 with a persistent S wave in V6 (“pulmonary disease pattern”), implying rotation of the heart due to right ventricular dilatation.
- Atrial tachyarrhythmias – AF, flutter, atrial tachycardia. Seen in 8% of patients.
- Non-specific ST segment and T wave changes, including ST elevation and depression. Reported in up to 50% of patients with PE.
Simultaneous T wave inversions in the inferior (II, III, aVF) and right precordial leads (V1-4) is the most specific finding in favour of PE.
References
Further Reading
- Wiesbauer F, Kühn P. ECG Mastery: Yellow Belt online course. Understand ECG basics. Medmastery
- Wiesbauer F, Kühn P. ECG Mastery: Blue Belt online course: Become an ECG expert. Medmastery
- Kühn P, Houghton A. ECG Mastery: Black Belt Workshop. Advanced ECG interpretation. Medmastery
- Rawshani A. Clinical ECG Interpretation ECG Waves
- Smith SW. Dr Smith’s ECG blog.
- Wiesbauer F. Little Black Book of ECG Secrets. Medmastery PDF
TOP 100 ECG Series
Emergency Physician in Prehospital and Retrieval Medicine in Sydney, Australia. He has a passion for ECG interpretation and medical education | ECG Library |