ECG Rule of Fours
aka ECG Interpretation Made Easy
One day, in a town not too far from here, the ICU registrar (you) is admitting a 60 year old male, who has just been brought into the emergency department with profound weakness, and needed to be intubated for respiratory failure. They were struggling in the ER, all resuscitation bays were full, and ambulances are backing up outside. No lab tests are back and they hadn’t even done an ECG. You sigh, and agree to take the patient against your better judgement…
On your arrival in the ER, the emergency intern casually throws you the ECG.
I always struggle with ECG’s,” the intern stammers “I just don’t know where to start. I think it is abnormal, ‘cos it looks a bit of a mess.
You look at the ECG, your eyes widen and you immediately administer an intravenous medication.
Slowly… but steadily the patient recovers.
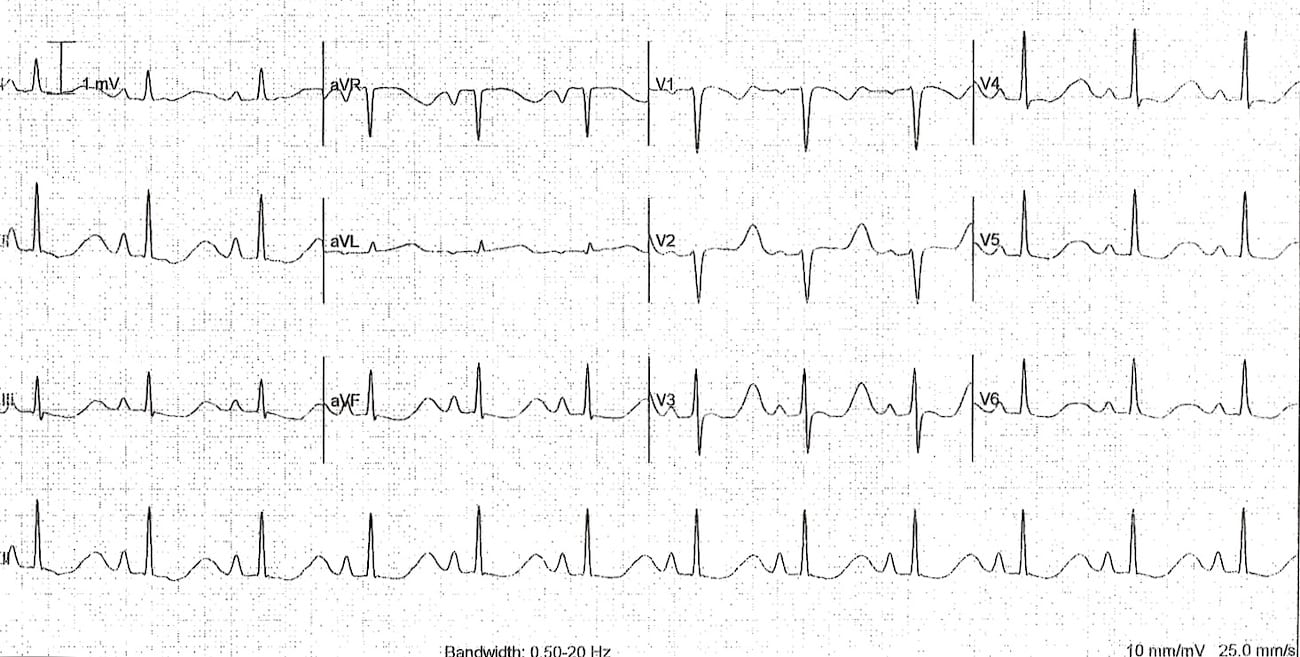
The ECG
The treatment?
What was the intravenous drug administered?
Potassium
- The patient was hypokalaemic with a potassium of 1.9
The Pimping
“How did you diagnose that so quickly?” the intern remonstrates, suspecting it was a fluke.
“Well,” you say, suspecting he knows something you don’t, “I use the ‘ECG Rule of Fours’. If you like, I’ll teach you how to read an ECG in 2 minutes.”
The intern laughs, and rolls his eyes – undoubtedly thinking “Here we go again – another cocky ICU registrar with the answers to the universe.”
You ignore your telepathic assumption, and go on… “The ‘ECG Rule of Fours’, like my approach to Resuscitation, is to Keep It Simple Stupid!”
Note to self: Remember to point to yourself when emphasising the word Stupid. You don’t want ANOTHER complaint of harassment…
The ECG ‘Rule of Fours’
- Four Initial Features
- Four Waves
- Four Intervals
Simple Huh!
The key is to read each ECG methodically, following the basic structure, looking at all leads, (and please please PLEASE try not to cheat and look at the computer interpretation…).
So let’s take a brief look at each of the above.
The FOUR INITIAL FEATURES to look for on an ECG
(1) History/ Clinical Picture
This is THE MOST IMPORTANT thing to look at on ANY ECG. Remember, an ECG is just like any other test, and should always be interpreted in the clinical context, perhaps even more so.
Simple things need to be recorded, like the name, age, time, patient symptoms (e.g. chest pain) and other clinical features.
Also do a quick check for lead placement errors:
- Limb leads: (a) check aVR for upside down P, QRS and T waves, (b) aVL and aVR should generally be mirror images.
- Chest leads: look for RS pattern in V1 – changing progressively to QR pattern in V6.
(2) Rate
- The normal value is between 60-100/min. Lower than this is bradycardia, higher is tachycardia.
(3) Rhythm
- Is the rhythm sinus or is it another rhythm? If so, what?
(4) Axis
- Discussion of “axis” is a whole other blog in itself, so don’t get too hung up about it! The easiest way to learn is with ‘SAM Super Axis Man‘.
The FOUR WAVES (or complexes) on an ECG
(1) P wave
- Lead II is usually the best lead place to look at the P wave morphology.
- Observe the P-wave morphology e.g. in particular P pulmonale or P mitrale.
(2) QRS complexes (or QRS “waves”)
- Look in ALL leads for the presence of Q waves.
- Observe the QRS amplitude and look for QRS progression through the chest leads.
(3) T waves
- Look in ALL leads for T waves.
- Look for T wave inversion, T wave concordance or discordance with QRS and the presence of T wave flattening.
(4) U waves
- Are U waves present or not?
The FOUR INTERVALS (or segments) on an ECG
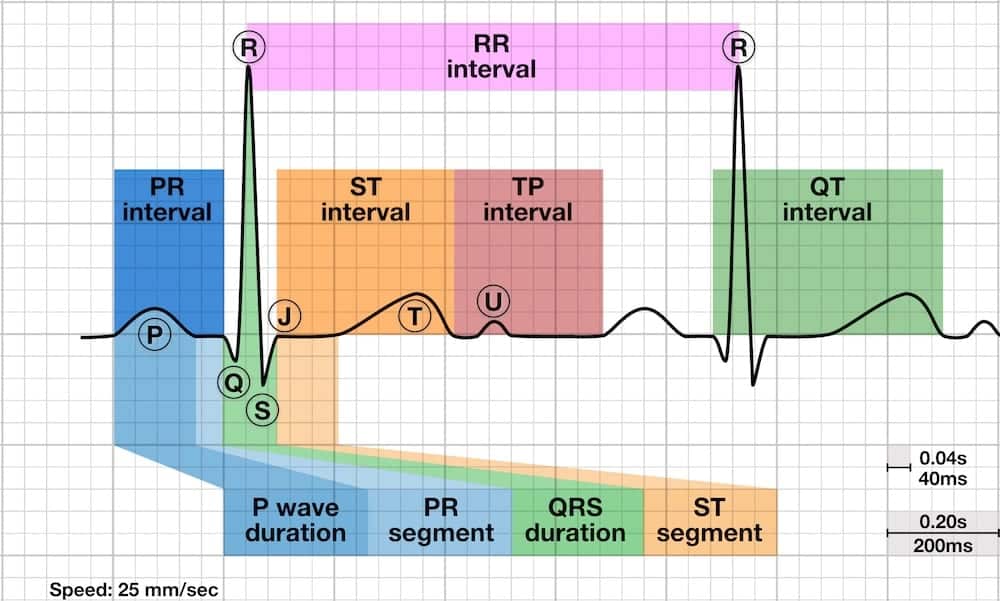
(1) PR interval
- The PR interval is normally between 0.12-0.20 seconds (3-5 small squares).
- A prolonged or changing (esp lengthening) PR interval indicates heart block. Shortened PR intervals can be because of WPW or LGL syndromes, or a junctional rhythm.
(2) QRS width (“QRS-interval”)
- The QRS-interval is normally less than 0.12 seconds (3 small squares).
- A widened QRS width indicates some sort of conduction defect with the left or right bundle branches.
(3) ST segment (“ST-interval”)
- This is probably the most important thing to look at.
- …then look at it a 2nd and 3rd time. Look for sloping (especially downsloping) or flattening of the ST segments.
(4) QT interval
- The QT interval is the time from the start of the Q wave to the end of the T wave.
In clinical context
Now we’ve gone through the system, let’s use the ”ECG Rule of Fours” to interpret the ECG we were presented with above.
FOUR Initial Features (History, Rate, Rhythm, Axis)
(1) History: 60 year old male, weakness and respiratory failure. Lead placement looks ok. (ECG anonymised, but should have a sticker)
- Hmmmm, this is sounding suspicious already…
(2) Rate – 90 per minute.
(3) Rhythm – Sinus rhythm (P-waves followed by QRS complexes).
(4) Axis – about 60 degrees (using Super Axis Man in leads I and aVF).
FOUR Waves (P, QRS, T, U)
(1) P-waves – present but peaked (p-pulmonale).
(2) QRS “waves” – all looking pretty normal.
(3) T-waves – very unusual looking, generally widespread biphasic pattern. Difficult to distinguish from U- waves… Actually, they ARE U-waves! There is also T/U wave discordance in V2.
(4) U-waves – Enough said!
FOUR Intervals (PR, QRS, ST, QT)
(1) PR interval – looks a bit long. Computer says 212ms… I’ll go with the computer…
(2) QRS complex “interval” – looks quite narrow, definitely not widened.
(3) ST segment “interval” – difficult to tell. In most leads, it almost looks like there is down-sloping ST depression, but I think in the context of what we already know (especially the history), I think an ischaemic cause is not the top diagnosis.
(4) QT interval – looks long, and in fact some would say the QT should really be measured at the end of the U wave! Computer says 504ms… so let’s lock it in!
What is the diagnosis?
These ECG changes are typical of hypokalaemia.
But even if you didn’t know that, using the “ECG Rule of Fours” you would still be able to accurately describe the ECG to a more experienced practitioner (e.g. your boss, over the phone), leading to the diagnosis.
References
- LITFL ECG Library Basics
- Super Axis Man SAM
- BMJ ECG Interpretation series: “ABC of clinical electrocardiography” February – June 2002 (15 articles + one errata) – A concise and easy to read series, which covers basic ECG interpretation, ischaemia and acute MI, broad complex tachycardias, atrial arrhythmias, extra-cardiac conditions (e.g. metabolic), exercise testing, and even paediatric ECG interpretation!

ECG LIBRARY
Electrocardiogram
Specialist Intensive Care Physician working at the Austin Hospital, Melbourne. Interests: Shoulder Dislocations, Pain Management, End-of-life care, Organ Donation and ECGs | Linkedin |


Hypokalemia is often mistaken for prolonged QT, when the T wave diminishes in lieu of a pronounced U wave…very tricky indeed!
Thank you SO MUCH for these articles. I’ve done two online ECG courses for school and still feel like I know absolutely nothing. The school should just scrap those courses and have us look at these articles on this website. 30 minutes of looking at your articles last night taught me more than those courses combined. You make it so straight forward!
I just want to say , wow!!! Little.com is wonderful. I am amazed by your explanations. Regards
Thank you for your efforts to teach ECG interpretation and make us understand our clients problem and support help them and. it is an excellent resource worse to read and prescribe. sincerely.
Sorry, but I can’t see the U wave. Anybody please indicate it for me?
Hi Tuyet! It’s the waveform that looks like a T wave that just precedes the p waves. The T’s are inverted and between the ST segment and the U waves. super small and hard to see until the author pointed them out!