
![]()
P wave
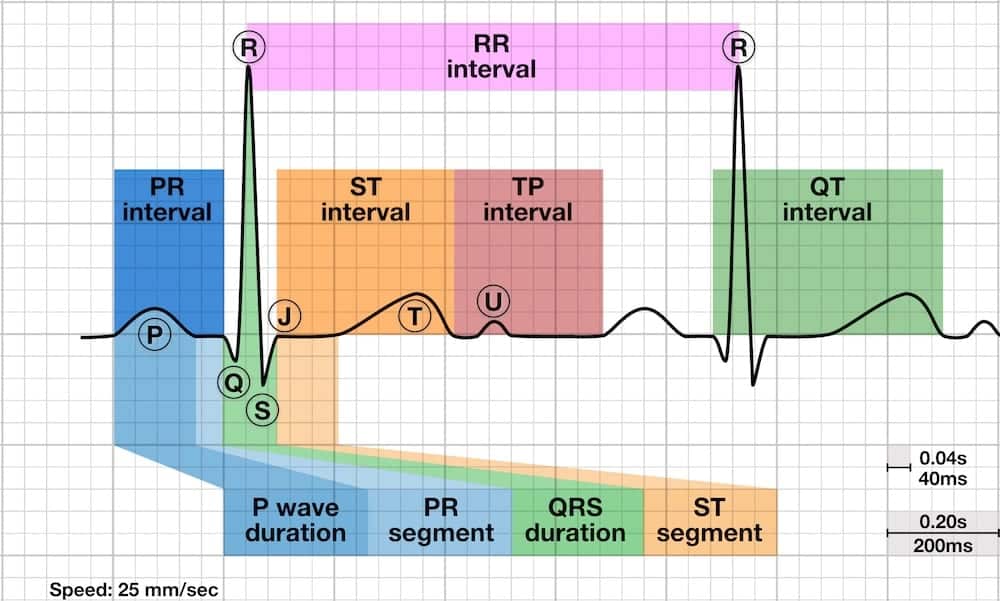
P Wave Overview
The P wave is the first positive deflection on the ECG and represents atrial depolarisation.
- The P wave is the first positive deflection on the ECG
- It represents atrial depolarisation
- Normal duration: < 0.12 s (< 120ms or 3 small squares)
Characteristics of the Normal Sinus P Wave
Morphology
- Smooth contour
- Monophasic in lead II
- Biphasic in V1
Axis
- Normal P wave axis is between 0° and +75°
- P waves should be upright in leads I and II, inverted in aVR
Duration
- < 0.12 s (<120ms or 3 small squares)
Amplitude
- < 2.5 mm (0.25mV) in the limb leads
- < 1.5 mm (0.15mV) in the precordial leads
Atrial abnormalities are most easily seen in the inferior leads (II, III and aVF) and lead V1, as the P waves are most prominent in these leads.
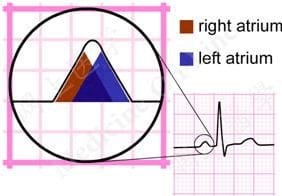
The Atrial Waveform – Relationship to the P wave
- Atrial depolarisation proceeds sequentially from right to left, with the right atrium activated before the left atrium
- The right and left atrial waveforms summate to form the P wave
- The first 1/3 of the P wave corresponds to right atrial activation, the final 1/3 corresponds to left atrial activation; the middle 1/3 is a combination of the two
- In most leads (e.g. lead II), the right and left atrial waveforms move in the same direction, forming a monophasic P wave
- However, in lead V1 the right and left atrial waveforms move in opposite directions. This produces a biphasic P wave with the initial positive deflection corresponding to right atrial activation and the subsequent negative deflection denoting left atrial activation
- This separation of right and left atrial electrical forces in lead V1 means that abnormalities affecting each individual atrial waveform can be discerned in this lead. Elsewhere, the overall shape of the P wave is used to infer the atrial abnormality
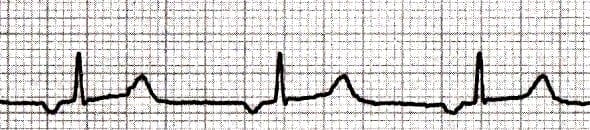
Normal P-wave Morphology – Lead II
- The right atrial depolarisation wave (brown) precedes that of the left atrium (blue)
- The combined depolarisation wave, the P wave, is less than 120 ms wide and less than 2.5 mm high
Right Atrial Enlargement – Lead II
- In right atrial enlargement, right atrial depolarisation lasts longer than normal and its waveform extends to the end of left atrial depolarisation
- Although the amplitude of the right atrial depolarisation current remains unchanged, its peak now falls on top of that of the left atrial depolarisation wave
- The combination of these two waveforms produces a P waves that is taller than normal (> 2.5 mm), although the width remains unchanged (< 120 ms)

Left Atrial Enlargement – Lead II
- In left atrial enlargement, left atrial depolarisation lasts longer than normal but its amplitude remains unchanged
- Therefore, the height of the resultant P wave remains within normal limits but its duration is longer than 120 ms
- A notch (broken line) near its peak may or may not be present (“P mitrale”)
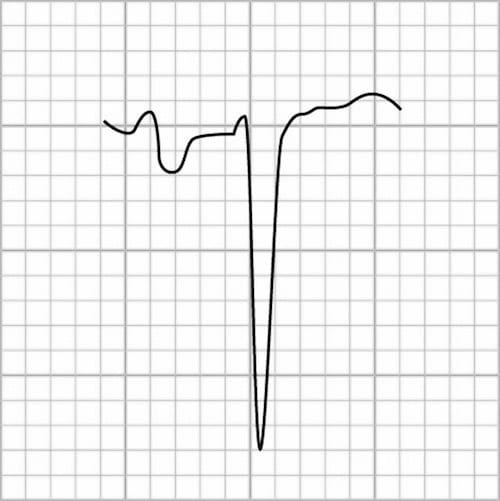
Normal P-wave Morphology – Lead V1
The P wave is typically biphasic in V1, with similar sizes of the positive and negative deflections.

Right Atrial Enlargement – Lead V1
Right atrial enlargement causes increased height (> 1.5mm) in V1 of the initial positive deflection of the P wave.

NB. This patient also has evidence of right ventricular hypertrophy.
Left Atrial Enlargement – V1
Left atrial enlargement causes widening (> 40ms wide) and deepening (> 1mm deep) in V1 of the terminal negative portion of the P wave.
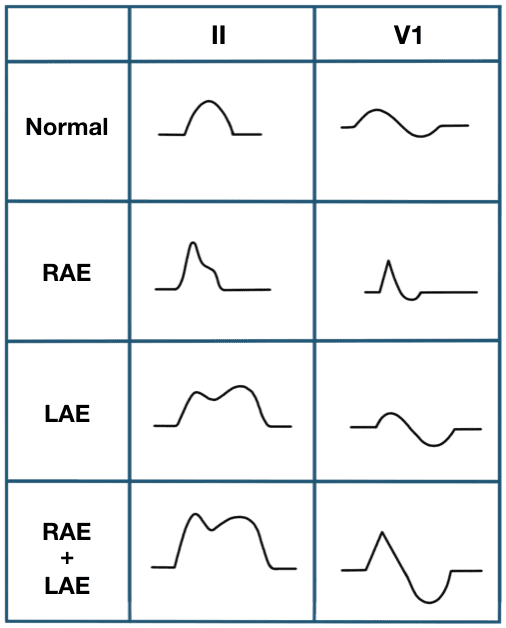
Biatrial enlargement is diagnosed when criteria for both right and left atrial enlargement are present on the same ECG. The spectrum of P-wave changes in leads II and V1 with right, left and bi-atrial enlargement is summarised in the following diagram:
Common P Wave Abnormalities
- P mitrale (bifid P waves), seen with left atrial enlargement
- P pulmonale (peaked P waves), seen with right atrial enlargement
- P wave inversion, seen with ectopic atrial and junctional rhythms
- Variable P wave morphology, seen in multifocal atrial rhythms
P Mitrale
The presence of broad, notched (bifid) P waves in lead II is a sign of left atrial enlargement, classically due to mitral stenosis.
P Pulmonale
The presence of tall, peaked P waves in lead II is a sign of right atrial enlargement, usually due to pulmonary hypertension (e.g. cor pulmonale from chronic respiratory disease).
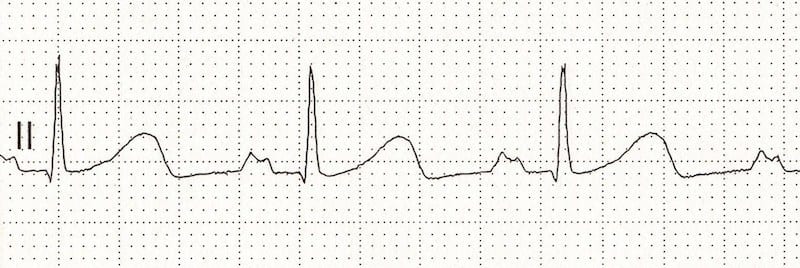
Inverted P Waves
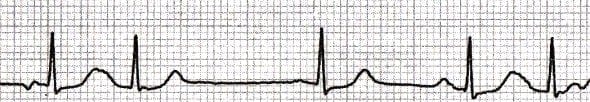
P-wave inversion in the inferior leads indicates a non-sinus origin of the P waves. When the PR interval is < 120 ms, the origin is in the AV junction (e.g. accelerated junctional rhythm):
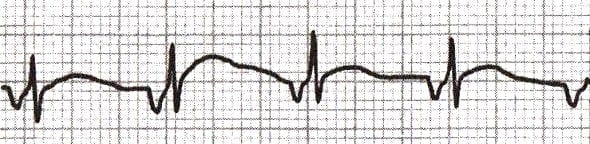
When the PR interval is ≥ 120 ms, the origin is within the atria (e.g. ectopic atrial rhythm):
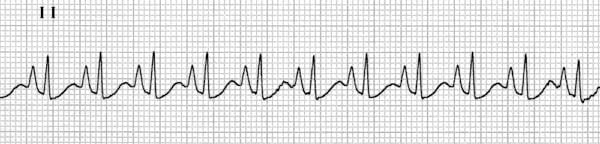
Variable P-Wave Morphology
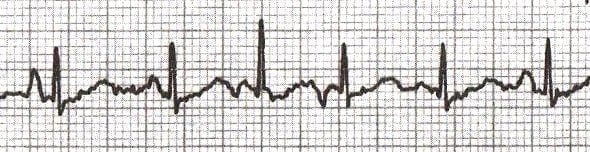
The presence of multiple P wave morphologies indicates multiple ectopic pacemakers within the atria and/or AV junction. If ≥ 3 different P wave morphologies are seen, then multifocal atrial rhythm is diagnosed:
If ≥ 3 different P wave morphologies are seen and the rate is ≥ 100, then multifocal atrial tachycardia (MAT) is diagnosed:
Related Topics
- Left Atrial Enlargement
- Right Atrial Enlargement
- Biatrial Enlargement
- Accelerated junctional rhythm
- Ectopic Atrial Rhythm
- Multifocal atrial tachycardia
- Lewis lead placement
References
- Chung DC, Nelson HM. ECG – A Pictorial Primer [internet]
- Edhouse J, Thakur RK, Khalil JM. ABC of clinical electrocardiography. Conditions affecting the left side of the heart. BMJ. 2002 May 25;324(7348):1264-7
- Harrigan RA, Jones K. ABC of clinical electrocardiography. Conditions affecting the right side of the heart. BMJ. 2002 May 18;324(7347):1201-4
ECG Library Basics
Advanced Reading
Online
- Wiesbauer F, Kühn P. ECG Mastery: Yellow Belt online course. Understand ECG basics. Medmastery
- Wiesbauer F, Kühn P. ECG Mastery: Blue Belt online course: Become an ECG expert. Medmastery
- Kühn P, Houghton A. ECG Mastery: Black Belt Workshop. Advanced ECG interpretation. Medmastery
- Rawshani A. Clinical ECG Interpretation ECG Waves
- Smith SW. Dr Smith’s ECG blog.
- Wiesbauer F. Little Black Book of ECG Secrets. Medmastery PDF
Textbooks
- Zimmerman FH. ECG Core Curriculum. 2023
- Mattu A, Berberian J, Brady WJ. Emergency ECGs: Case-Based Review and Interpretations, 2022
- Straus DG, Schocken DD. Marriott’s Practical Electrocardiography 13e, 2021
- Brady WJ, Lipinski MJ et al. Electrocardiogram in Clinical Medicine. 1e, 2020
- Mattu A, Tabas JA, Brady WJ. Electrocardiography in Emergency, Acute, and Critical Care. 2e, 2019
- Hampton J, Adlam D. The ECG Made Practical 7e, 2019
- Kühn P, Lang C, Wiesbauer F. ECG Mastery: The Simplest Way to Learn the ECG. 2015
- Grauer K. ECG Pocket Brain (Expanded) 6e, 2014
- Surawicz B, Knilans T. Chou’s Electrocardiography in Clinical Practice: Adult and Pediatric 6e, 2008
- Chan TC. ECG in Emergency Medicine and Acute Care 1e, 2004
LITFL Further Reading
- ECG Library Basics – Waves, Intervals, Segments and Clinical Interpretation
- ECG A to Z by diagnosis – ECG interpretation in clinical context
- ECG Exigency and Cardiovascular Curveball – ECG Clinical Cases
- 100 ECG Quiz – Self-assessment tool for examination practice
- ECG Reference SITES and BOOKS – the best of the rest
ECG LIBRARY
BA MA (Oxon) MBChB (Edin) FACEM FFSEM. Emergency physician, Sir Charles Gairdner Hospital. Passion for rugby; medical history; medical education; and asynchronous learning #FOAMed evangelist. Co-founder and CTO of Life in the Fast lane | On Call: Principles and Protocol 4e| Eponyms | Books |

MBBS FACEM DDU (Emergency) CCPU. Emergency Physician in Melbourne, Australia. Co-Ultrasound Lead for Emergency Medicine at The Alfred Hospital. Special interests in diagnostic and procedural ultrasound, medical education, and ECG interpretation. Editor of the LITFL ECG Library.

I am very thankful for your lessons. I really couldn’t find such a good explanation elsewhere. I am very grateful. Thanks.
A simple clarification scientific knowledge deep thankful
exquisitely explained , cant thank you enough. we all are very grateful for this.
[…] https://litfl.com/p-wave-ecg-library/ […]
Thankyou for clear and concise material
Very easy to understand.
A very clear and concise explanation
Thanks for above the clarity information, it is very easily understandable
Thank you very much.
It’s a concise presentation to understand P wave completely
I would Like to say Thanks very much, you make ECG reading and understanding easy and clear for us