
![]()
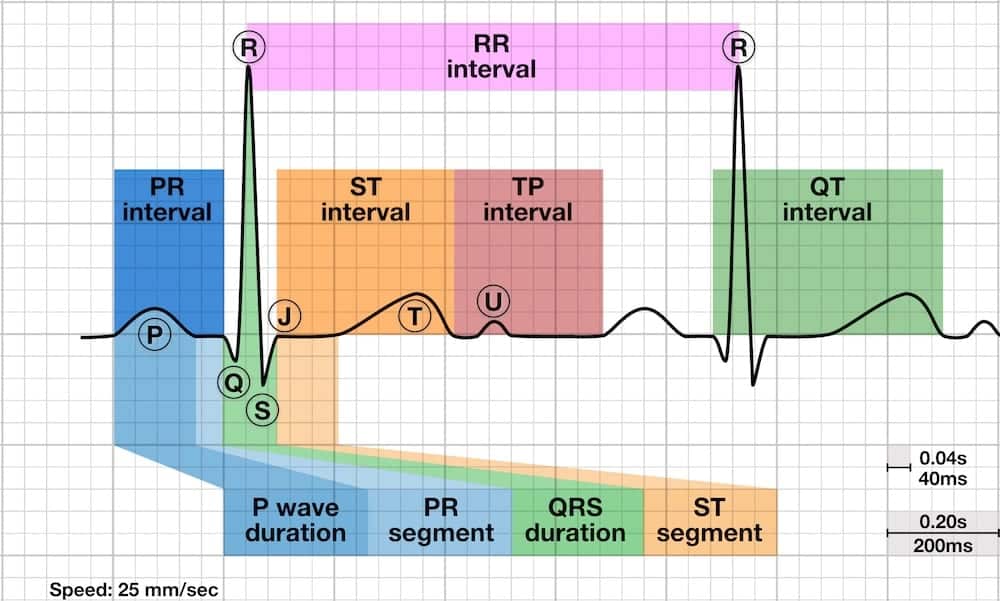
The ST Segment
S-T Segment
The ST segment is the flat, isoelectric section of the ECG between the end of the S wave (the J point) and the beginning of the T wave.
- The ST Segment represents the interval between ventricular depolarization and repolarization.
- The most important cause of ST segment abnormality (elevation or depression) is myocardial ischaemia or infarction.
Causes of ST Segment Elevation
- Acute myocardial infarction
- Coronary vasospasm (Printzmetal’s angina)
- Pericarditis
- Benign early repolarization
- Left bundle branch block
- Left ventricular hypertrophy
- Ventricular aneurysm
- Brugada syndrome
- Ventricular paced rhythm
- Raised intracranial pressure
- Takotsubo Cardiomyopathy
Morphology of the Elevated ST segment
Myocardial Infarction
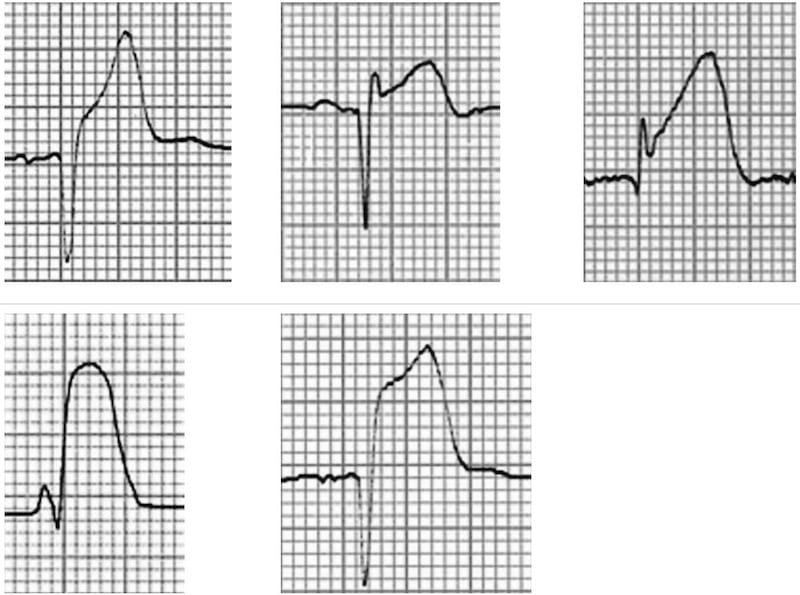
Acute STEMI may produce ST elevation with either concave, convex or obliquely straight morphology.
ST Segment Morphology in Other Conditions

Patterns of ST Elevation
Acute ST elevation myocardial infarction (STEMI)
ST segment elevation and Q-wave formation in contiguous leads. Follow the links above to find out more about the different STEMI patterns.:
- Septal (V1-2)
- Anterior (V3-4)
- Lateral (I + aVL, V5-6)
- Inferior (II, III, aVF)
- Right ventricular (V1, V4R)
- Posterior (V7-9)
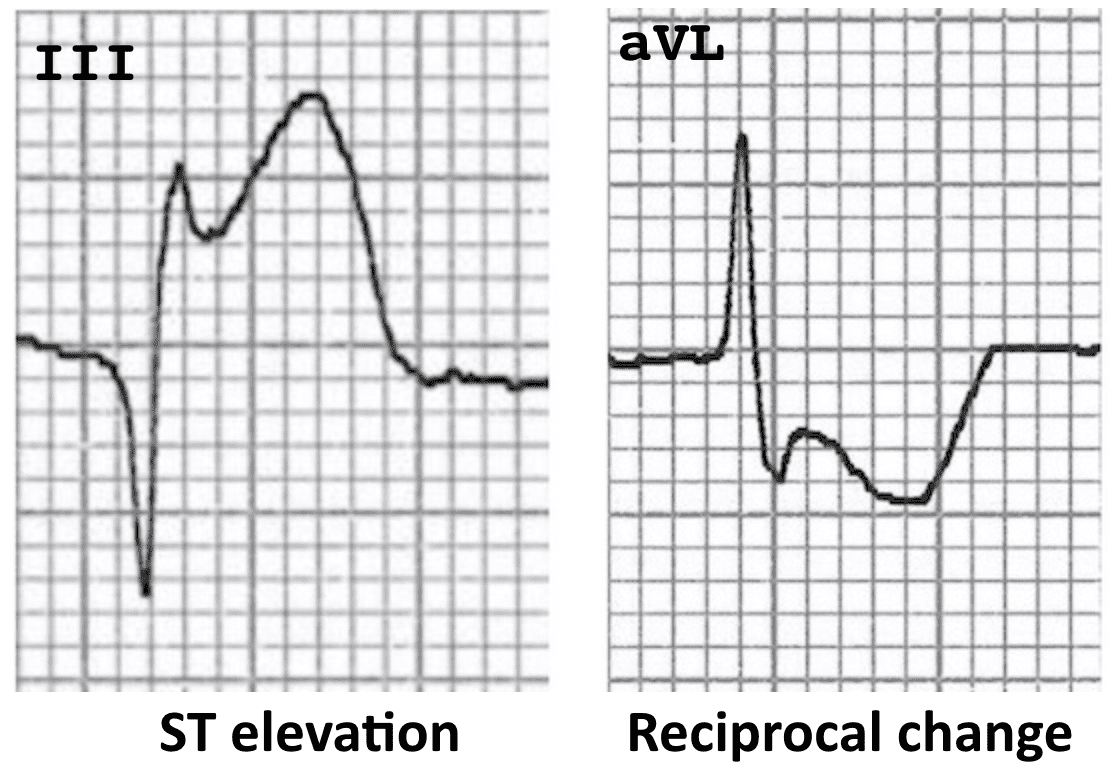
There is usually reciprocal ST depression in the electrically opposite leads. For example, STE in the high lateral leads I + aVL typically produces reciprocal ST depression in lead III (see example below).

Coronary Vasospasm (Prinzmetal’s angina)
- This causes a pattern of ST elevation that is very similar to acute STEMI — i.e. localised ST elevation with reciprocal ST depression occurring during episodes of chest pain.
- However, unlike acute STEMI the ECG changes are transient, reversible with vasodilators and not usually associated with myocardial necrosis.
- It may be impossible to differentiate these two conditions based on the ECG alone.
Pericarditis
Acute Pericarditis causes widespread concave (“saddleback”) ST segment elevation with PR segment depression in multiple leads, typically involving I, II, III, aVF, aVL, and V2-6.
- Concave “saddleback” ST elevation in leads I, II, III, aVF, V5-6 with depressed PR segments.
- There is reciprocal ST depression and PR elevation in leads aVR and V1.
- Spodick’s sign was first described by David H. Spodick in 1974 as a downward sloping TP segment with specificity for acute pericarditis.
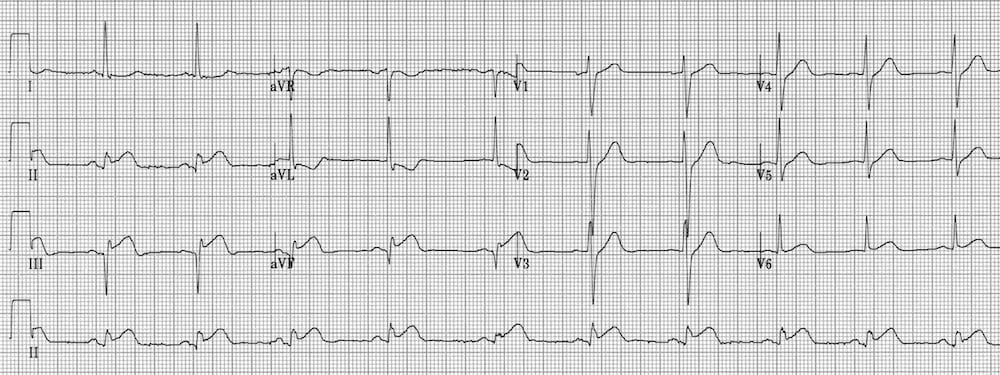
Benign Early Repolarization
Benign Early Repolarization (BER) causes mild ST elevation with tall T-waves mainly in the precordial leads. BER is a normal variant commonly seen in young, healthy patients. There is often notching of the J-point — the “fish-hook” pattern.
The ST changes may be more prominent at slower heart rates and disappear in the presence of tachycardia.
There is slight concave ST elevation in the precordial and inferior leads with notching of the J-point (the “fish-hook” pattern)
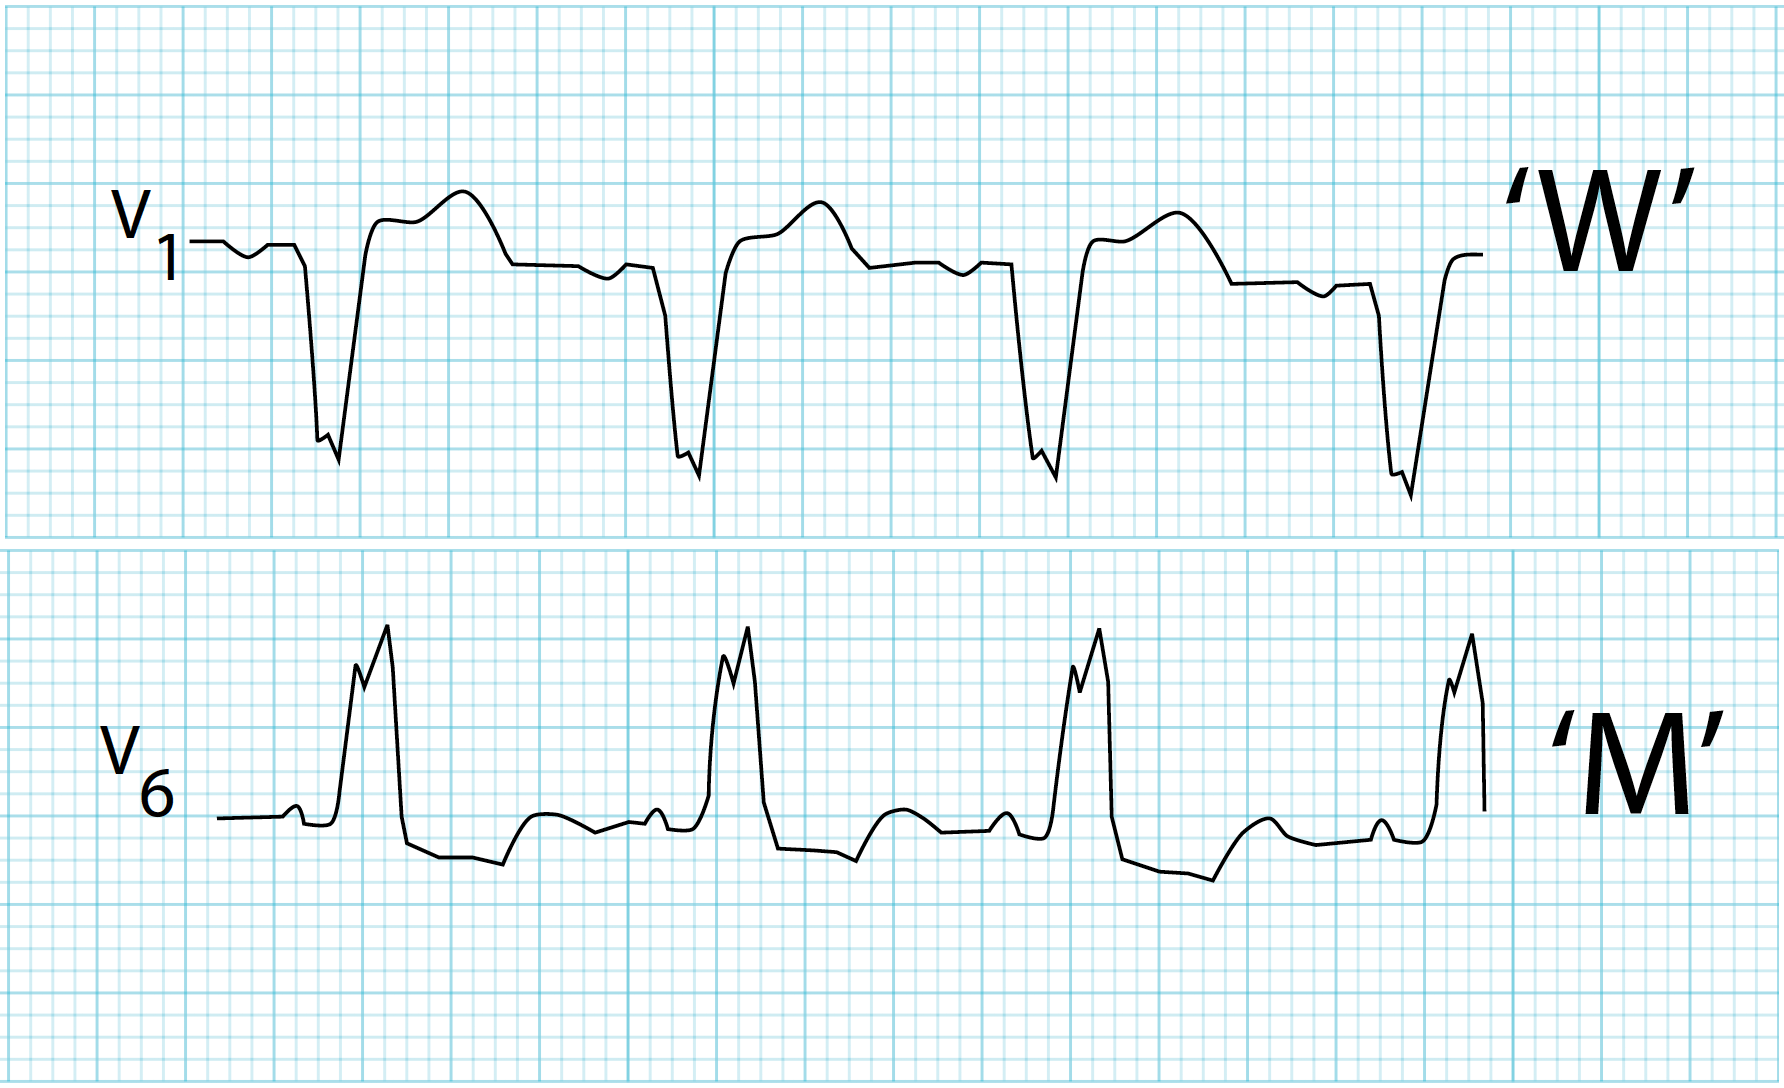
Left Bundle Branch Block (LBBB)
In Left bundle branch block (LBBB), the ST segments and T waves show “appropriate discordance” — i.e. they are directed opposite to the main vector of the QRS complex.
This produces ST elevation and upright T waves in leads with a negative QRS complex (dominant S wave), while producing ST depression and T wave inversion in leads with a positive QRS complex (dominant R wave).
- Note the ST elevation in leads with deep S waves — most apparent in V1-3.
- Also note the ST depression in leads with tall R waves — most apparent in I and aVL.
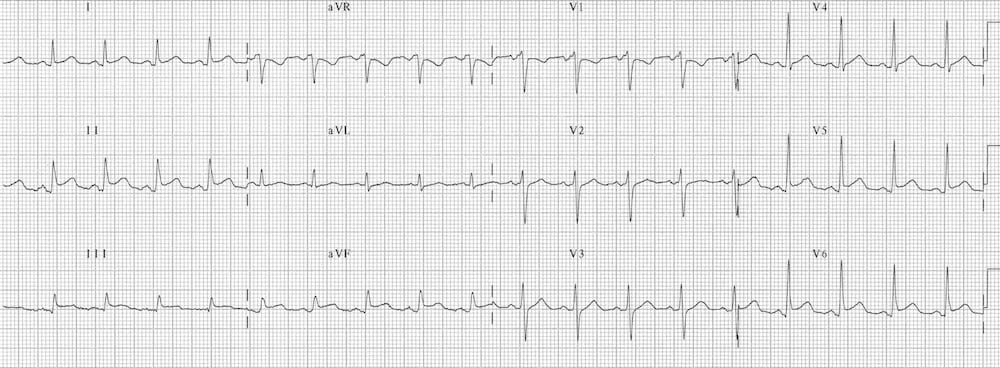
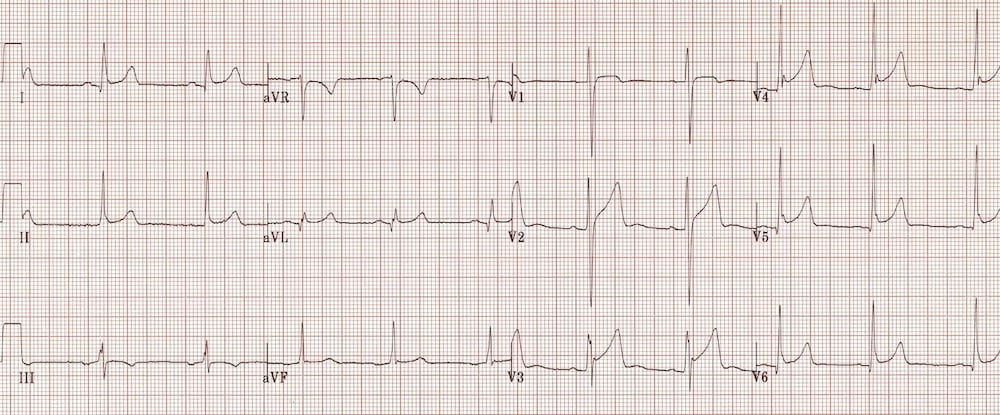
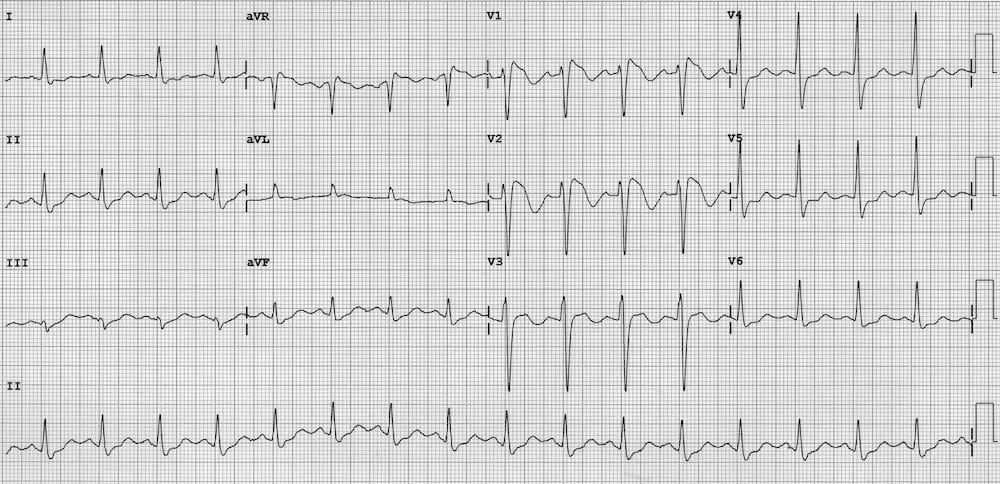
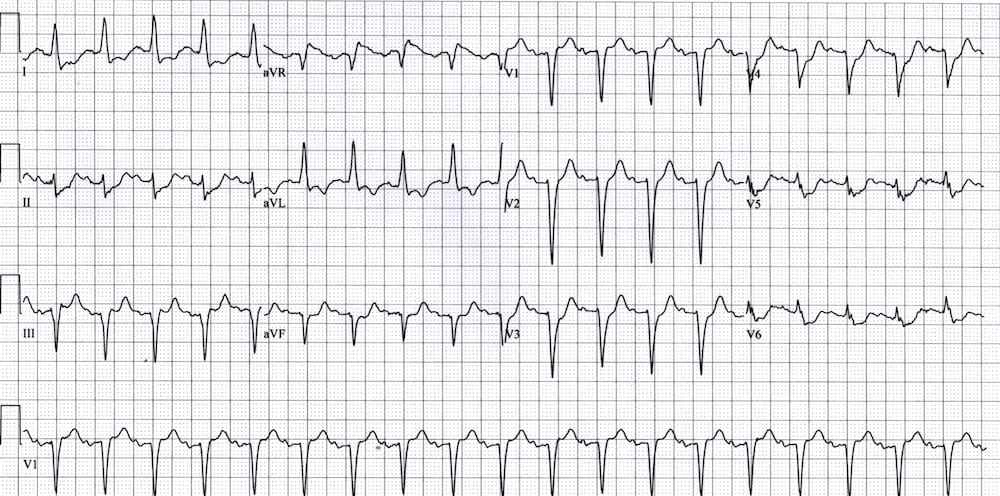
Left Ventricular Hypertrophy (LVH)
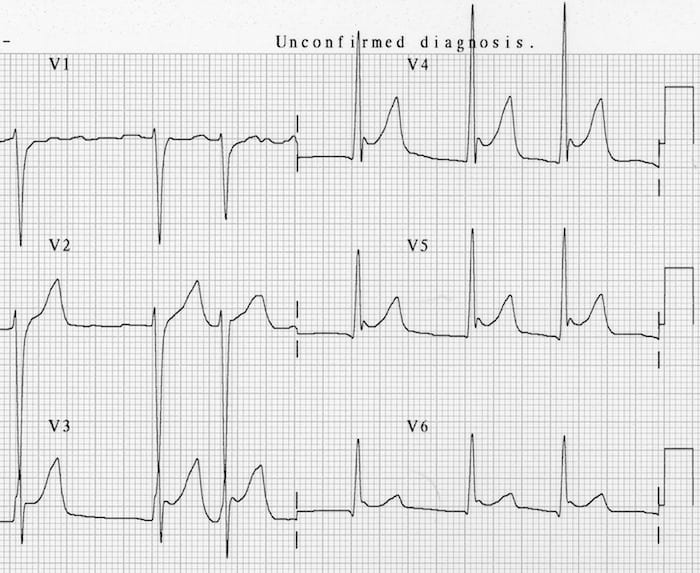
Left Ventricular Hypertrophy (LVH) causes a similar pattern of repolarization abnormalities as LBBB, with ST elevation in the leads with deep S-waves (usually V1-3) and ST depression/T-wave inversion in the leads with tall R waves (I, aVL, V5-6).
- Left axis deviation
- Deep S waves with ST elevation in V1-3
- ST depression and T-wave inversion in the lateral leads V5-6
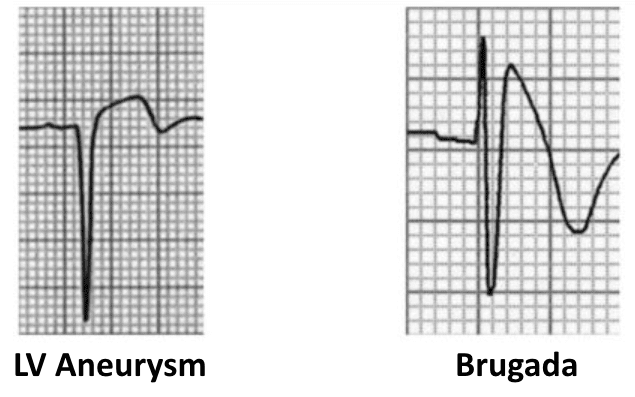
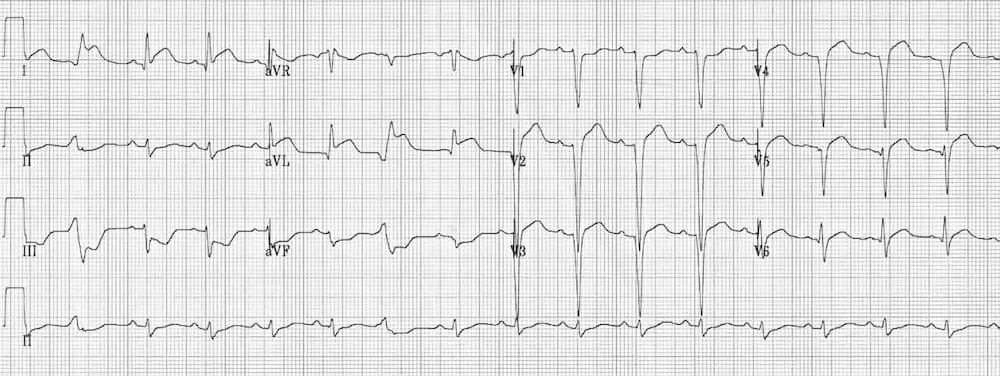
Ventricular Aneurysm
This is an ECG pattern of Ventricular Aneurysm – residual ST elevation and deep Q waves seen in patients with previous myocardial infarction. It is associated with extensive myocardial damage and paradoxical movement of the left ventricular wall during systole.
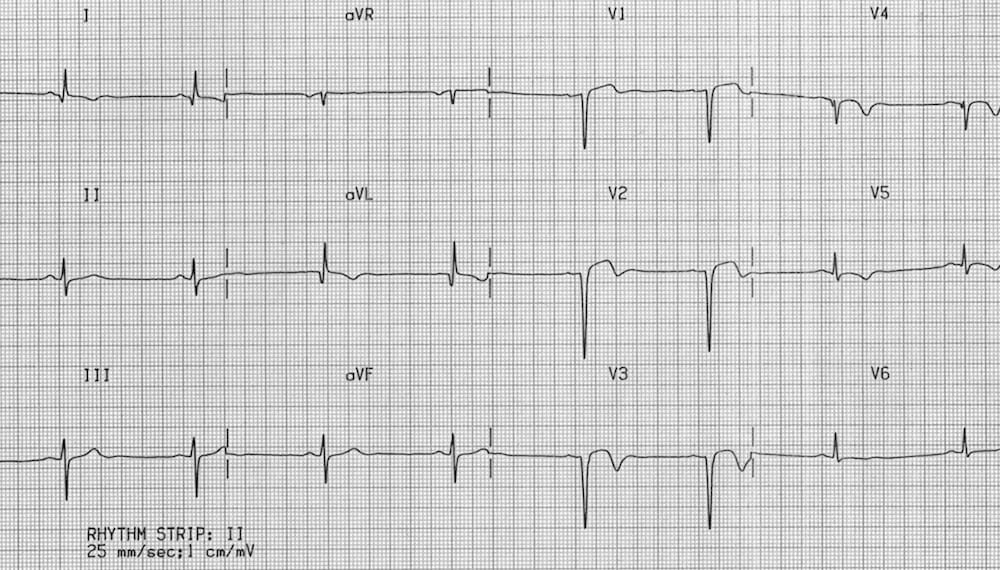
- There is ST elevation with deep Q waves and inverted T waves in V1-3.
- This pattern suggests the presence of a left ventricular aneurysm due to a prior anteroseptal MI.
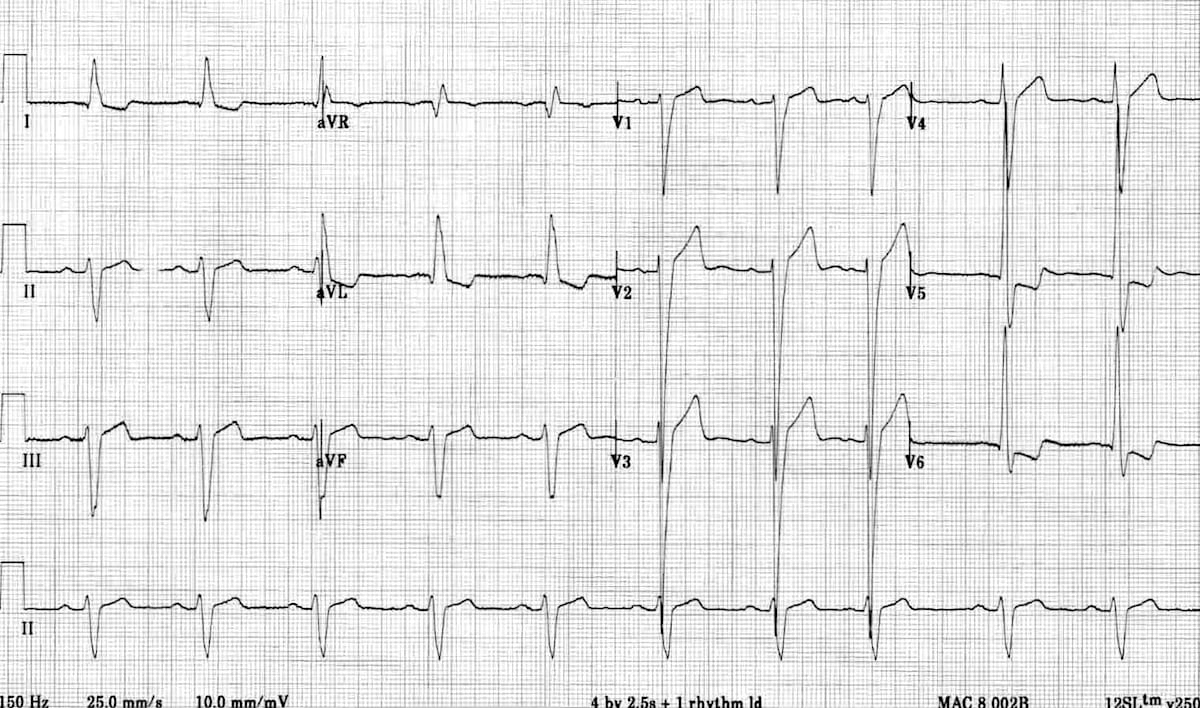
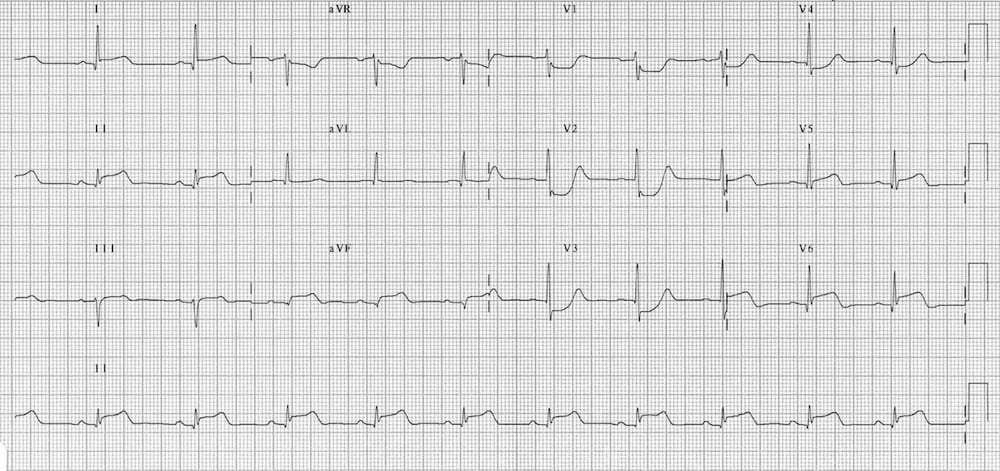
Brugada Syndrome
Brugada Syndrome is an inherited channelopathy (a disease of myocardial sodium channels) that leads to paroxysmal ventricular arrhythmias and sudden cardiac death in young patients.
The tell-tale sign on the resting ECG is the “Brugada sign” — ST elevation and partial RBBB in V1-2 with a “coved” morphology.
There is ST elevation and partial RBBB in V1-2 with a coved morphology — the “Brugada sign”.
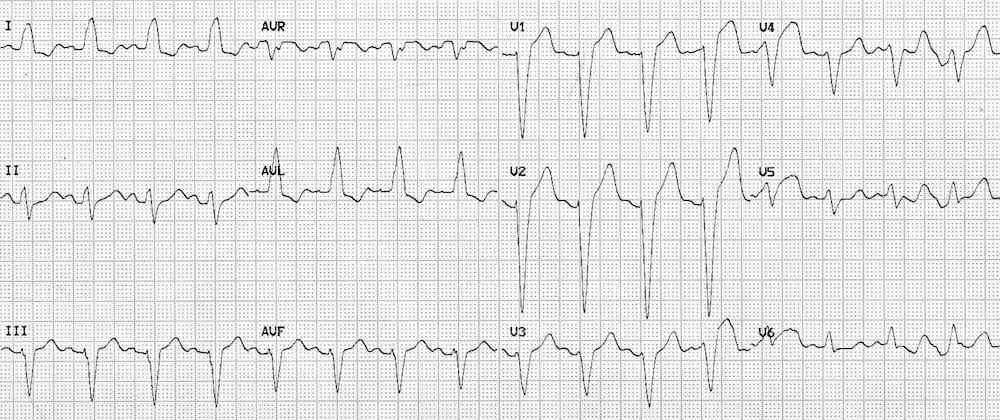
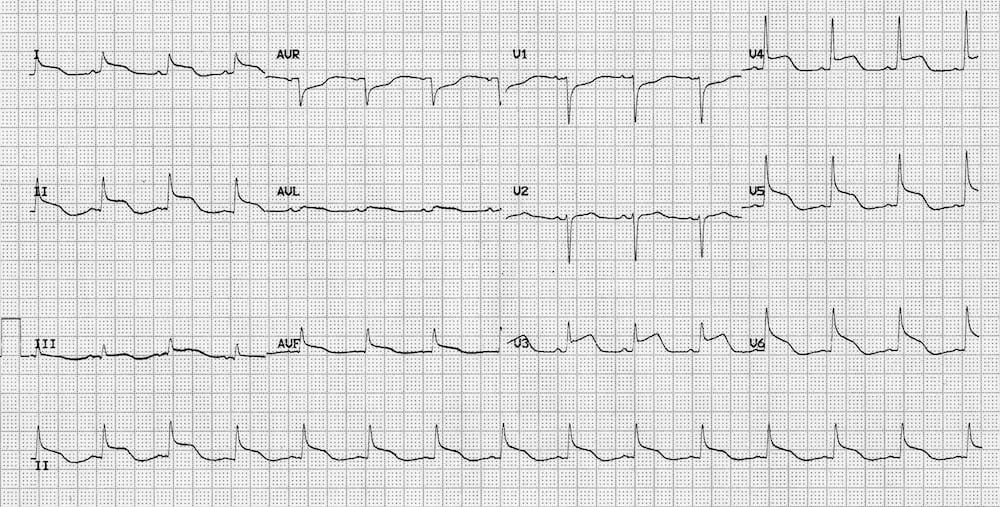
Ventricular Paced Rhythm
Ventricular pacing (with a pacing wire in the right ventricle) causes ST segment abnormalities identical to that seen in LBBB. There is appropriate discordance, with the ST segment and T wave directed opposite to the main vector of the QRS complex.

Raised Intracranial Pressure
Raised Intracranial Pressure (ICP) (e.g. due to intracranial haemorrhage, traumatic brain injury) may cause ST elevation or depression that simulates myocardial ischaemia or pericarditis.
More commonly, raised ICP is associated with widespread, deep T-wave inversions (“cerebral T waves“).
Widespread ST elevation with concave (pericarditis-like) morphology in a patient with severe traumatic brain injury.
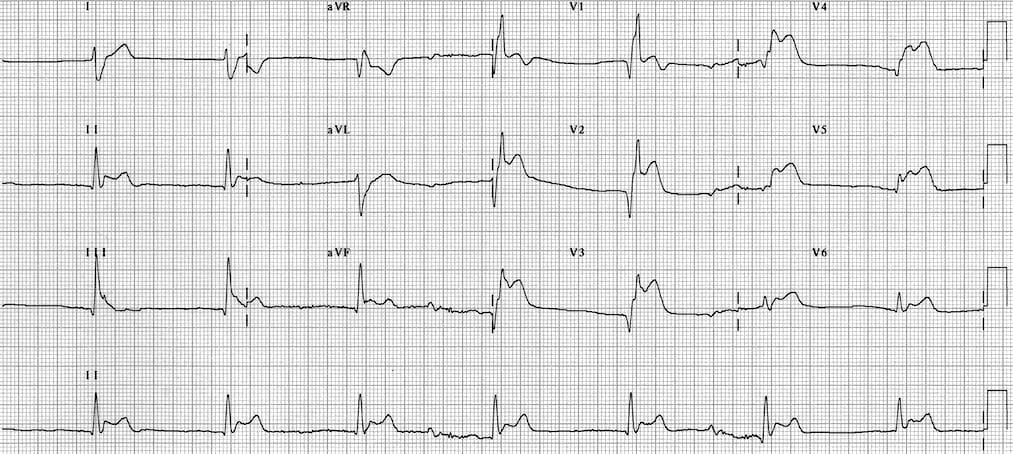
Takotsubo Cardiomyopathy
Takotsubo Cardiomyopathy: A STEMI mimic producing ischaemic chest pain, ECG changes +/- elevated cardiac enzymes with characteristic regional wall motion abnormalities on echocardiography.
Typically occurs in the context of severe emotional distress (“broken heart syndrome“). Commonly associated with new ECG changes (ST elevation or T wave inversion) or moderate troponin rise.
Less Common Causes of ST segment Elevation
- Pulmonary embolism and acute cor pulmonale (usually in lead III)
- Acute aortic dissection (classically causes inferior STEMI due to RCA dissection)
- Hyperkalaemia
- Sodium-channel blocking drugs (secondary to QRS widening)
- J-waves (hypothermia, hypercalcaemia)
- Following electrical cardioversion
- Others: Cardiac tumour, myocarditis, pancreas or gallbladder disease
Transient ST elevation after DC cardioversion from VF

J waves in hypothermia simulating ST elevation
Causes of ST Depression
- Myocardial ischaemia / NSTEMI
- Reciprocal change in STEMIPosterior MI
- Digoxin effect
- Hypokalaemia
- Supraventricular tachycardia
- Right bundle branch block
- Right ventricular hypertrophy
- Left bundle branch block
- Left ventricular hypertrophy
- Ventricular paced rhythm
Morphology of ST Depression
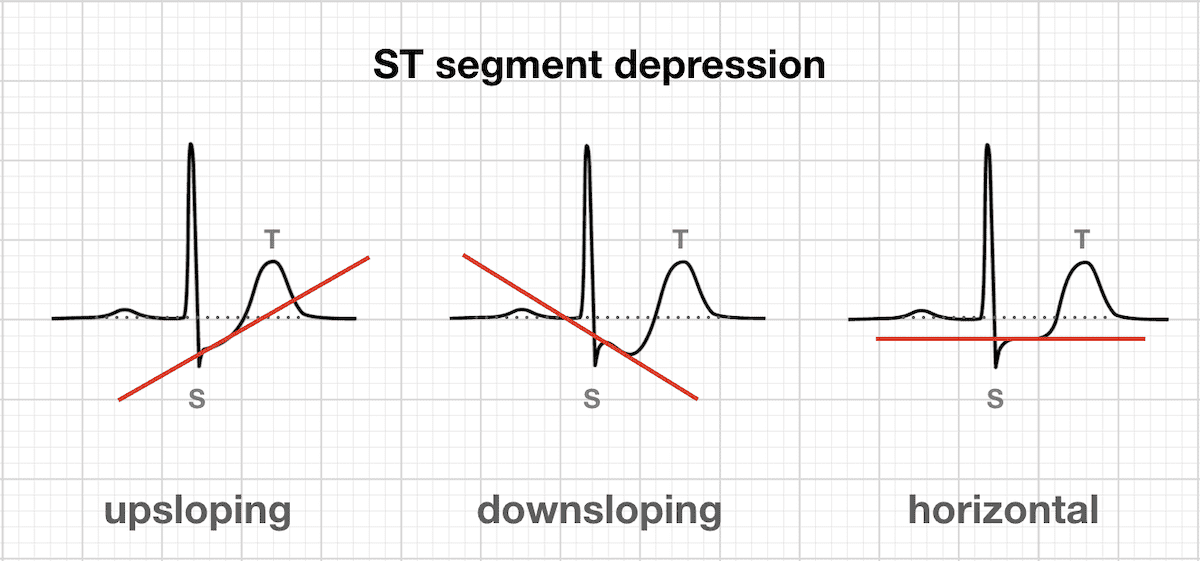
- ST depression can be either upsloping, downsloping, or horizontal.
- Horizontal or downsloping ST depression ≥ 0.5 mm at the J-point in ≥ 2 contiguous leads indicates myocardial ischaemia (according to the 2007 Task Force Criteria).
- Upsloping ST depression in the precordial leads with prominent De Winter T waves is highly specific for occlusion of the LAD.
- Reciprocal change has a morphology that resembles “upside down” ST elevation and is seen in leads electrically opposite to the site of infarction.
- Posterior MI manifests as horizontal ST depression in V1-3 and is associated with upright T waves and tall R waves.
ST Segment depression
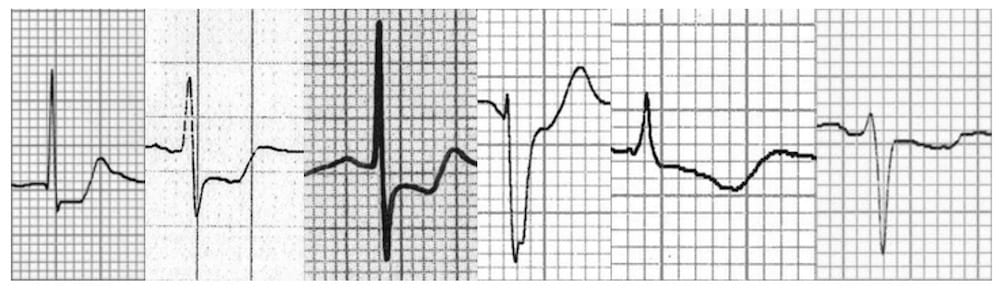
ST segment morphology in myocardial ischaemia
Reciprocal change
ST segment morphology in posterior MI

Patterns of ST depression
Myocardial Ischaemia
ST depression due to subendocardial ischaemia may be present in a variable number of leads and with variable morphology. It is often most prominent in the left precordial leads V4-6 plus leads I, II and aVL.
Widespread ST depression with ST elevation in aVR is seen in left main coronary artery occlusion and severe triple vessel disease.
NB. ST depression localised to the inferior or high lateral leads is more likely to represent reciprocal change than subendocardial ischaemia. The corresponding ST elevation may be subtle and difficult to see, but should be sought. This concept is discussed further here.
Reciprocal Change
ST elevation during acute STEMI is associated with simultaneous ST depression in the electrically opposite leads:
- Inferior STEMI produces reciprocal ST depression in aVL (± lead I).
- Lateral or anterolateral STEMI produces reciprocal ST depression in III and aVF (± lead II).
- Reciprocal ST depression in V1-3 occurs with posterior infarction (see below).
- Reciprocal ST depression in aVL with inferior STEMI
- Reciprocal ST depression in III and aVF with high lateral STEMI
Posterior Myocardial Infarction
Acute posterior STEMI causes ST depression in the anterior leads V1-3, along with dominant R waves (“Q-wave equivalent”) and upright T waves. There is ST elevation in the posterior leads V7-9.
De Winter T Waves
De Winter T waves: a pattern of up-sloping ST depression with symmetrically peaked T waves in the precordial leads is considered to be a STEMI equivalent, and is highly specific for an acute occlusion of the LAD.

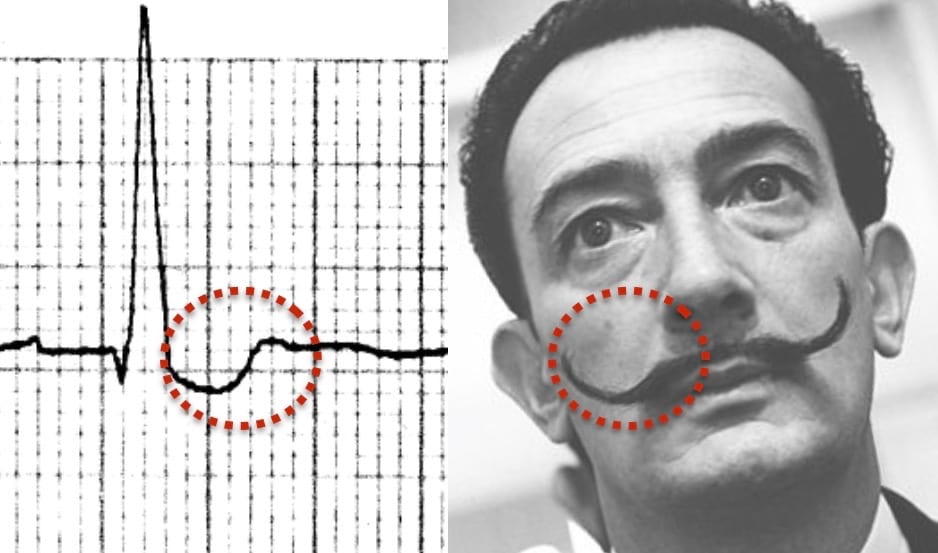
Digoxin Effect
Digoxin Effect: Treatment with digoxin causes downsloping ST depression with a “sagging” morphology, reminiscent of Salvador Dali’s moustache.
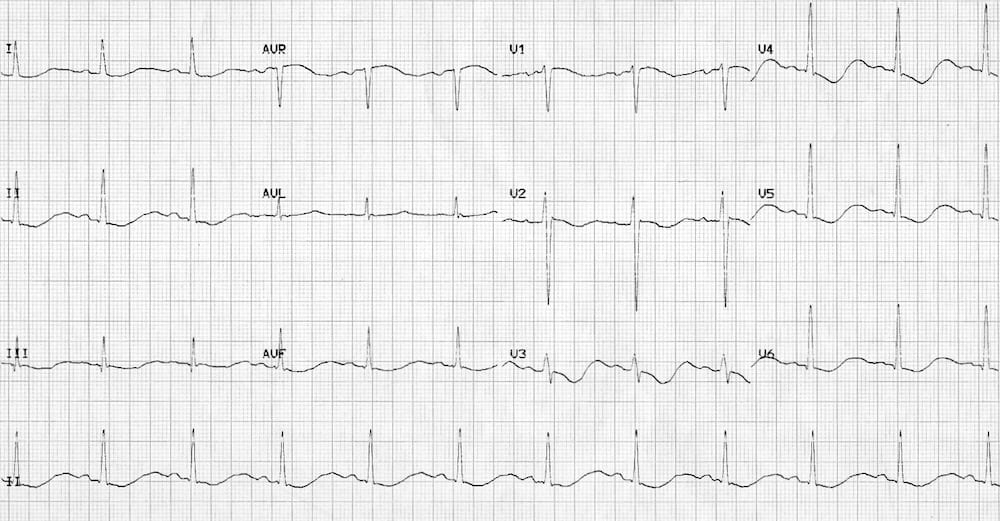
Hypokalaemia
Hypokalaemia causes widespread downsloping ST depression with T-wave flattening/inversion, prominent U waves and a prolonged QU interval.
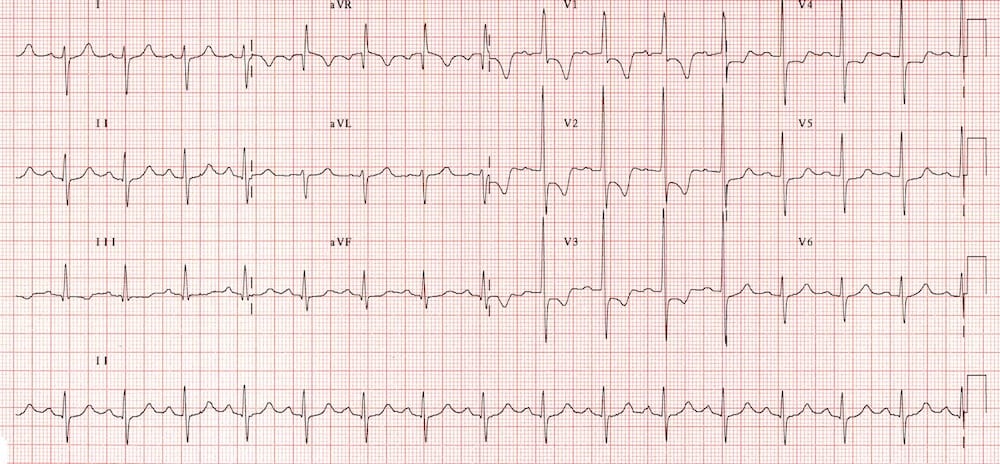
Right ventricular hypertrophy (RVH)
Right ventricular hypertrophy (RVH) causes ST depression and T-wave inversion in the right precordial leads V1-3.
Right Bundle Branch Block (RBBB)
Right Bundle Branch Block (RBBB) may produce a similar pattern of repolarisation abnormalities to RVH, with ST depression and T wave inversion in V1-3.

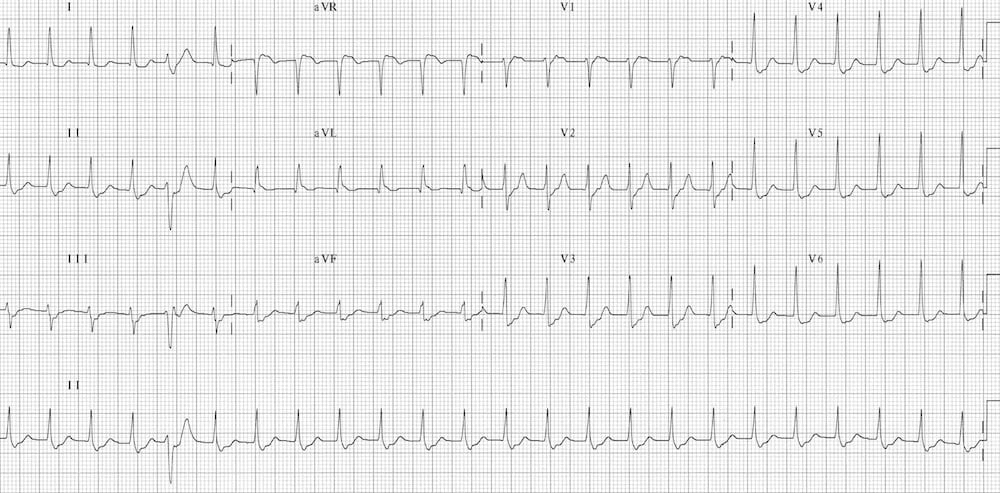
Supraventricular tachycardia (SVT)
Supraventricular tachycardia (e.g. AVNRT) typically causes widespread horizontal ST depression, most prominent in the left precordial leads (V4-6).
This rate-related ST depression does not necessarily indicate the presence of myocardial ischaemia, provided that it resolves with treatment.

References
- Edhouse J, Brady WJ, Morris F. ABC of clinical electrocardiography: Acute myocardial infarction-Part II. BMJ. 2002 Apr 20;324(7343):963-6
- Smith SW. T/QRS ratio best distinguishes ventricular aneurysm from anterior myocardial infarction. Am J Emerg Med. 2005 May;23(3):279-87.
ECG Library Basics
Advanced Reading
Online
- Wiesbauer F, Kühn P. ECG Mastery: Yellow Belt online course. Understand ECG basics. Medmastery
- Wiesbauer F, Kühn P. ECG Mastery: Blue Belt online course: Become an ECG expert. Medmastery
- Kühn P, Houghton A. ECG Mastery: Black Belt Workshop. Advanced ECG interpretation. Medmastery
- Rawshani A. Clinical ECG Interpretation ECG Waves
- Smith SW. Dr Smith’s ECG blog.
- Wiesbauer F. Little Black Book of ECG Secrets. Medmastery PDF
Textbooks
- Zimmerman FH. ECG Core Curriculum. 2023
- Mattu A, Berberian J, Brady WJ. Emergency ECGs: Case-Based Review and Interpretations, 2022
- Straus DG, Schocken DD. Marriott’s Practical Electrocardiography 13e, 2021
- Brady WJ, Lipinski MJ et al. Electrocardiogram in Clinical Medicine. 1e, 2020
- Mattu A, Tabas JA, Brady WJ. Electrocardiography in Emergency, Acute, and Critical Care. 2e, 2019
- Hampton J, Adlam D. The ECG Made Practical 7e, 2019
- Kühn P, Lang C, Wiesbauer F. ECG Mastery: The Simplest Way to Learn the ECG. 2015
- Grauer K. ECG Pocket Brain (Expanded) 6e, 2014
- Surawicz B, Knilans T. Chou’s Electrocardiography in Clinical Practice: Adult and Pediatric 6e, 2008
- Chan TC. ECG in Emergency Medicine and Acute Care 1e, 2004
LITFL Further Reading
- ECG Library Basics – Waves, Intervals, Segments and Clinical Interpretation
- ECG A to Z by diagnosis – ECG interpretation in clinical context
- ECG Exigency and Cardiovascular Curveball – ECG Clinical Cases
- 100 ECG Quiz – Self-assessment tool for examination practice
- ECG Reference SITES and BOOKS – the best of the rest
ECG LIBRARY
Emergency Physician in Prehospital and Retrieval Medicine in Sydney, Australia. He has a passion for ECG interpretation and medical education | ECG Library |

MBBS FACEM DDU (Emergency) CCPU. Emergency Physician in Melbourne, Australia. Co-Ultrasound Lead for Emergency Medicine at The Alfred Hospital. Special interests in diagnostic and procedural ultrasound, medical education, and ECG interpretation. Editor of the LITFL ECG Library.

Hello!
This is an excellent and concise article. Thank you!
If I could offer a quick comment, in the Left Ventricular Hypertrophy (LVH) section, under the ECG there is a note. The note says that there is RAD w/ a possible LPFB. I do not believe that is correct.
Unless I am missing something, I interp this as a LAD (logic = quadrant method + lead II check) w/ a possible LAFB (logic LAD + qR in lead 1 + aVL & rS in lead II, III, and aVF).
Thank you!