
![]()
Myocardial Ischaemia
This page covers the ECG signs of myocardial ischaemia seen with non-ST-elevation acute coronary syndromes (NSTEACS). ST-elevation and Q-wave myocardial infarction patterns are covered elsewhere: LMCA occlusion, Anterior STEMI, Lateral STEMI, Inferior STEMI, Right Ventricular Infarction, Posterior Infarction and Wellens syndrome
Myocardial Ischaemia Background
Non-ST-elevation acute coronary syndrome (NSTEACS) encompasses two main entities:
- Non-ST-elevation myocardial infarction (NSTEMI).
- Unstable angina pectoris (UAP).
The differentiation between these two conditions is usually retrospective, based on the presence/absence of raised cardiac enzymes at 8-12 hours after the onset of chest pain.
Both produce the same spectrum of ECG changes and symptoms and are managed identically in the Emergency Department.
Patterns of Myocardial Ischaemia
Two main ECG patterns associated with NSTEACS:
- ST segment depression
- T wave flattening or inversion
While there are numerous conditions that may simulate myocardial ischaemia (e.g. left ventricular hypertrophy, digoxin effect), dynamic ST segment and T wave changes (i.e. different from baseline ECG or changing over time) are strongly suggestive of myocardial ischaemia.
Other ECG patterns of ischaemia
- Hyperacute (peaked) T waves or pseudonormalisation of previously inverted T waves (i.e. becoming upright) suggest hyperacute STEMI.
- Another, less well-known ECG feature of myocardial ischaemia is U-wave inversion.
Morphology of ST Depression
- ST depression can be either upsloping, downsloping, or horizontal (see diagram below).
- Horizontal or downsloping ST depression ≥ 0.5 mm at the J-point in ≥ 2 contiguous leads indicates myocardial ischaemia (according to the 2007 Task Force Criteria).
- ST depression ≥ 1 mm is more specific and conveys a worse prognosis.
- ST depression ≥ 2 mm in ≥ 3 leads is associated with a high probability of NSTEMI and predicts significant mortality (35% mortality at 30 days).
- Upsloping ST depression is non-specific for myocardial ischaemia.
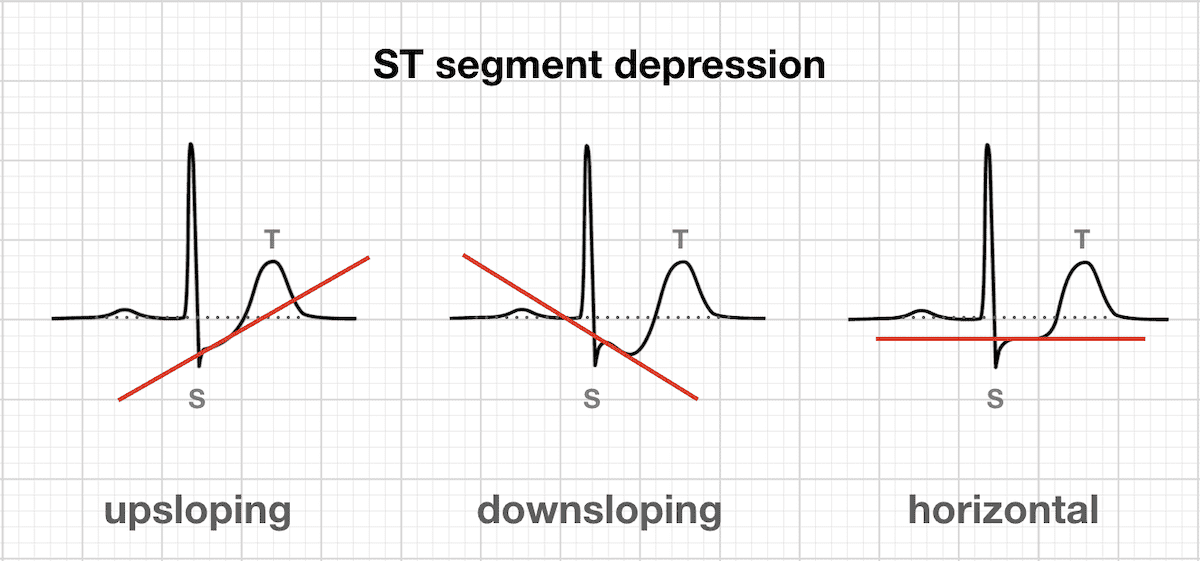
Examples of ST segment morphology in myocardial ischaemia

Distribution of ST segment depression
ST depression due to myocardial ischaemia may be present in a variable number of leads and with variable morphology:
- ST depression due to subendocardial ischaemia is usually widespread — typically present in leads I, II, V4-6 and a variable number of additional leads.
- A pattern of widespread ST depression plus ST elevation in aVR > 1 mm is suggestive of left main coronary artery occlusion.
- ST depression localised to a particular territory (esp. inferior or high lateral leads only) is more likely to represent reciprocal change due to STEMI. The corresponding ST elevation may be subtle and difficult to see, but should be sought.
- This concept of ST depression failing to localise is further discussed on Dr Smiths blog.
T wave inversion
T wave inversion may be considered to be evidence of myocardial ischaemia if:
- At least 1 mm deep
- Present in ≥ 2 continuous leads that have dominant R waves (R/S ratio > 1)
- Dynamic — not present on old ECG or changing over time
NB. T wave inversion is only significant if seen in leads with upright QRS complexes (dominant R waves). T wave inversion is a normal variant in leads III, aVR and V1.
Wellens Syndrome
- Wellens syndrome is a pattern of inverted or biphasic T waves in V2-4 (in patients presenting with ischaemic chest pain) that is highly specific for critical stenosis of the left anterior descending artery.
- Patients may be pain free by the time the ECG is taken and have normally or minimally elevated cardiac enzymes; however, they are at extremely high risk for extensive anterior wall MI within the next 2-3 weeks.
There are two patterns of T-wave abnormality in Wellens syndrome:
- Type A – Biphasic, with initial positivity and terminal negativity (25% of cases)
Type B – Deeply and symmetrically inverted (75% of cases)
Biphasic T Waves (Type A)
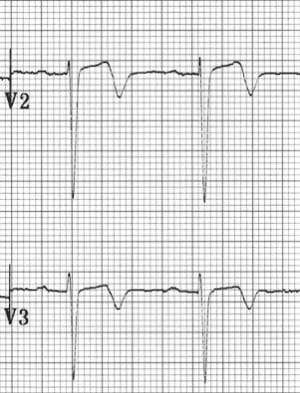
Deeply Inverted T Waves (Type B)

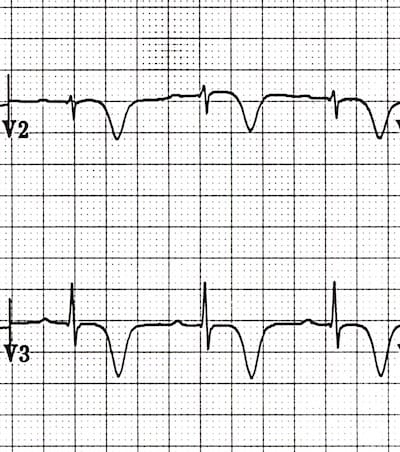
NB. There is confusion in the literature regarding the naming of the T wave patterns, with some authors using Type 1 (Type A) for biphasic T waves and Type 2 (Type B) for inverted. It may be better to just describe the T wave pattern!
Wellens wave evolution
T wave changes can evolve over time from Type A to Type B pattern (Smith et al).
![Evolution of T-wave inversion [A-D] after coronary reperfusion in STEMI reperfusion and in Wellens syndrome (NSTEMI)](https://litfl.com/wp-content/uploads/2018/08/Evolution-of-T-wave-inversion-A-D-after-coronary-reperfusion-in-STEMI-reperfusion-and-in-Wellens-syndrome-NSTEMI.png)
Non-specific ST segment and T wave changes
The following changes may occur with myocardial ischaemia but are relatively non-specific:
- ST depression < 0.5 mm
- T wave inversion < 1 mm
- T wave flattening
- Upsloping ST depression
More Myocardial Ischaemia ECG Examples
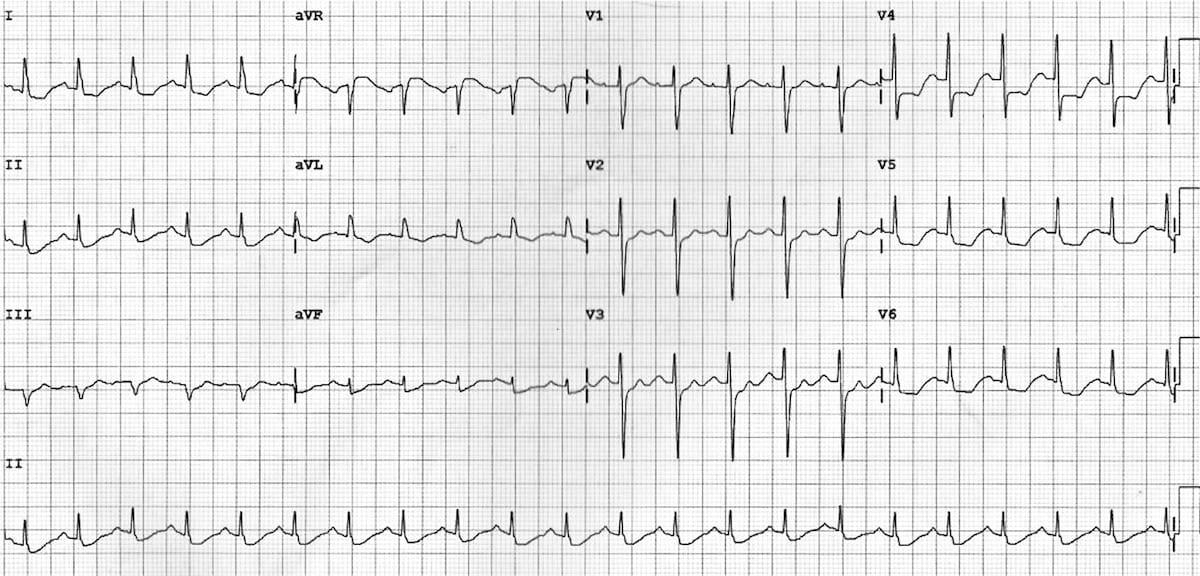
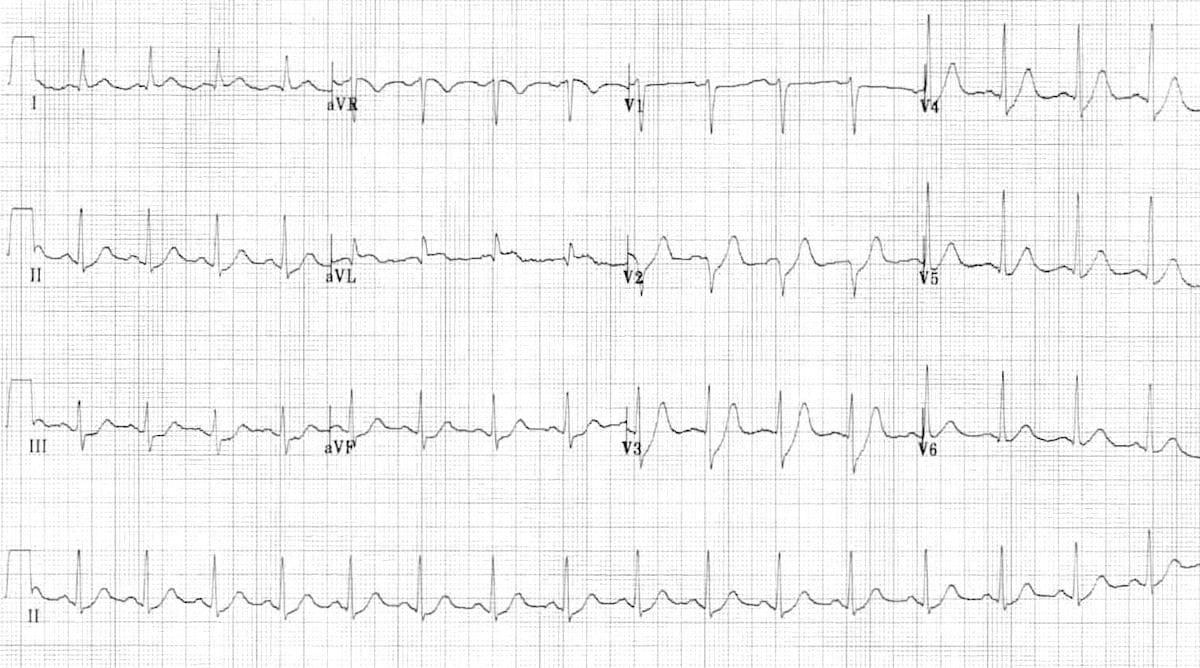
Example 1
Subendocardial ischaemia:
- The most striking abnormality is the widespread ST depression, seen in leads I, II and V5-6. This is consistent with widespread subendocardial ischaemia.
- There is also some subtle ST elevation in V1-2 and aVR with small Q waves in V1-2, suggesting that the cause of the widespread ischaemia is a proximal LAD occlusion.
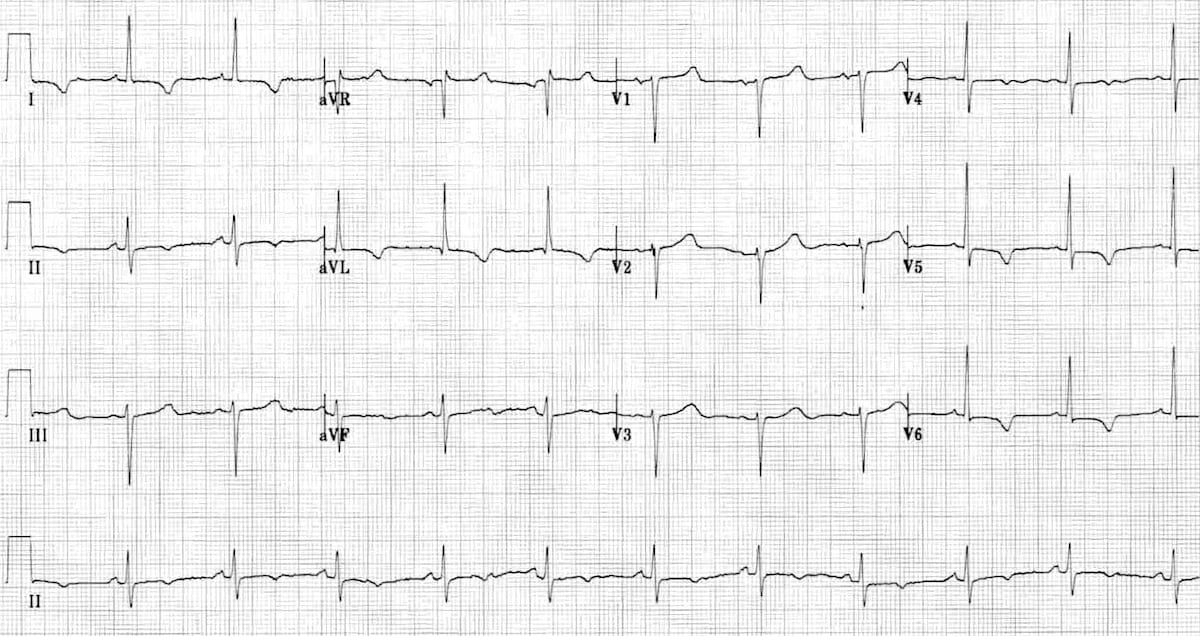
Example 2
Reciprocal change:
- The most obvious abnormality is the horizontal ST depression in III and aVF.
- This could be misinterpreted as “inferior ischaemia” — however, subendocardial ischaemia does not localise.
- Regional ST depression should prompt you to scrutinise the ECG for signs of reciprocal ST elevation… In this case there is subtle ST elevation in aVL.
- This is a high lateral STEMI!
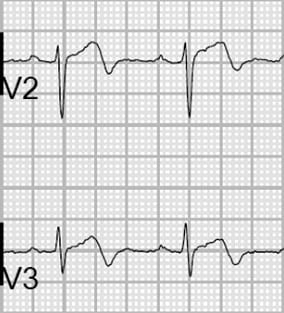
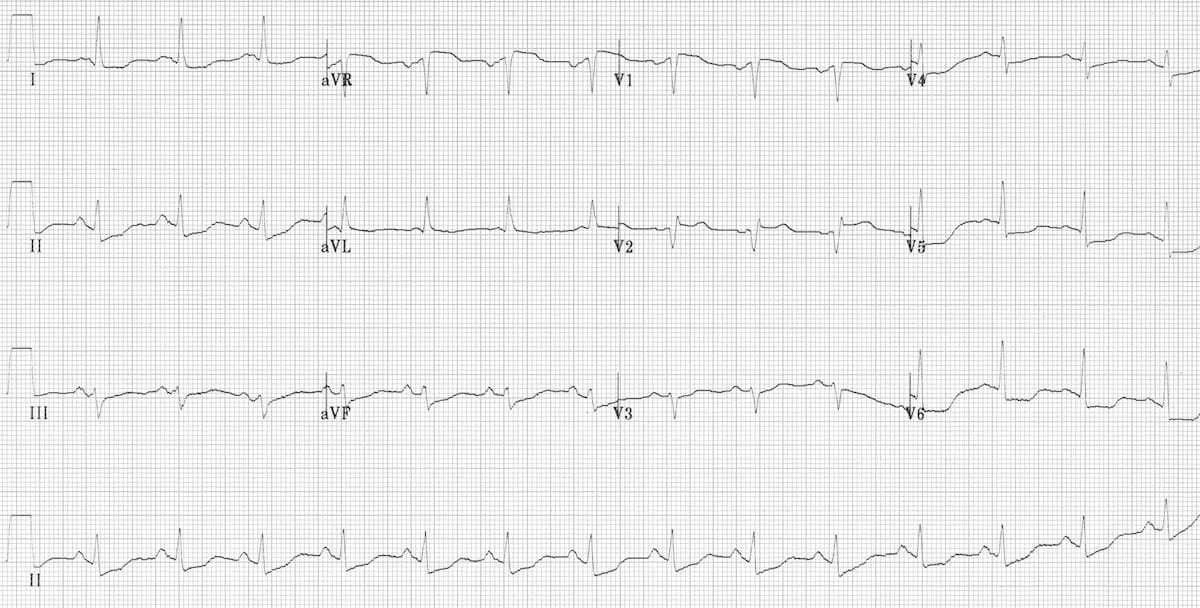
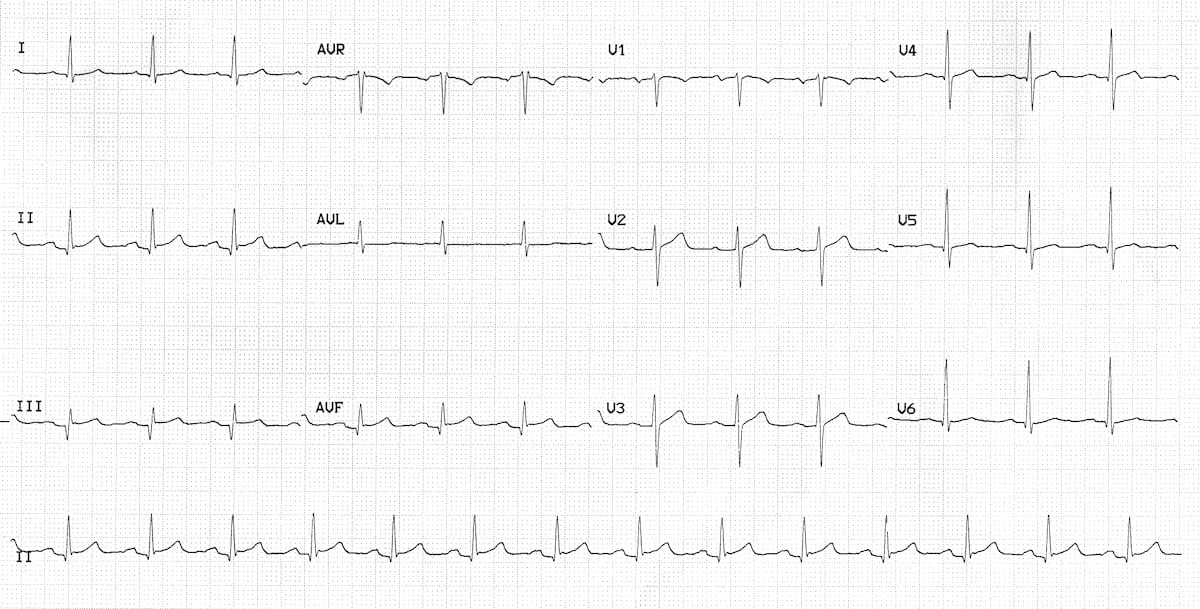
Example 3

Wellens Syndrome:
- There are abnormal T waves in V1-4 — biphasic in V1-3 and inverted in V4.
- This pattern is known as Type A Wellens Syndrome and is highly specific for a critical stenosis of the proximal LAD artery.
Example 4a

Dynamic ST depression in a patient with chest pain:
- Widespread ST depression (leads I, II, V5-6) indicates subendocardial ischaemia.
- Q wave in lead III with slightly elevated ST segment suggests the possibility of early inferior STEMI.
Example 4b
ECG of the same patient after treatment with oxygen, nitrates, heparin and anti-platelets:
- The ST changes have now resolved.
- Inferior ST segments and Q waves are stable — this patient had a history of prior inferior MI.
- Troponin was raised, confirming that the initial ST depression was due to NSTEMI.
Example 5
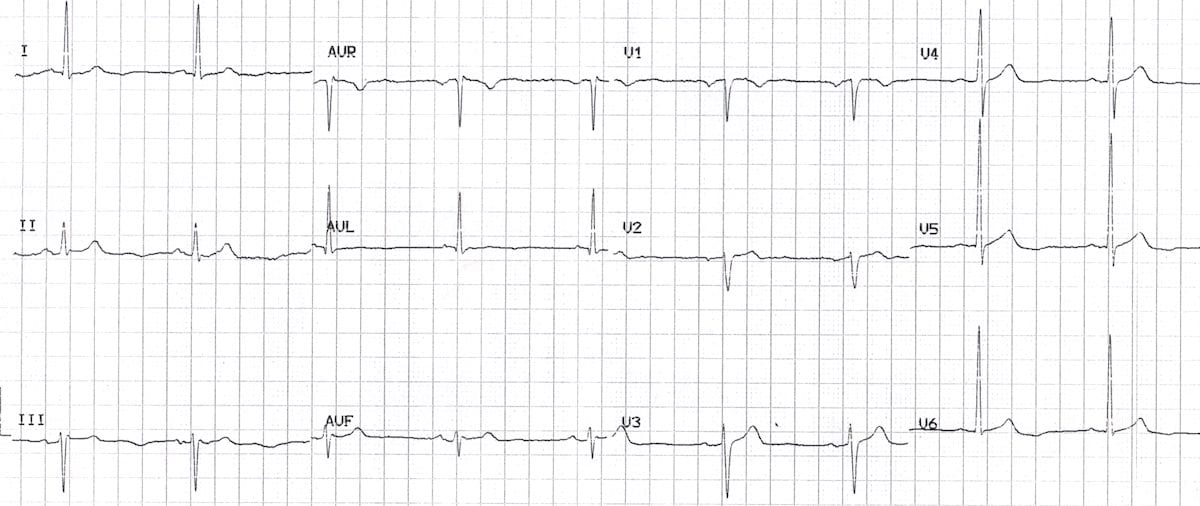
NSTEMI presenting with isolated U wave inversion:
- There are inverted U waves, most prominent in leads V5-6.
- This is an infrequently recognised but very specific sign of myocardial ischaemia — this patient had a 12-hour troponin of 4.0 ng/mL.
Want to find out the full story behind this ECG?.
Related Topics
- Left main coronary artery occlusion
- Wellens syndrome
- Anterior STEMI
- Lateral STEMI
- Inferior STEMI
- Right Ventricular Infarction
- Posterior Infarction
- “A Subtle Sign of Something Sinister” — a case of NSTEMI presenting with islolated U-wave inversion.
References
- Thygesen K, Alpert JS, White HD; Joint ESC/ACCF/AHA/WHF Task Force for the Redefinition of Myocardial Infarction. Universal definition of myocardial infarction. Eur Heart J. 2007 Oct;28(20):2525-38
Advanced Reading
Online
- Wiesbauer F, Kühn P. ECG Mastery: Yellow Belt online course. Understand ECG basics. Medmastery
- Wiesbauer F, Kühn P. ECG Mastery: Blue Belt online course: Become an ECG expert. Medmastery
- Kühn P, Houghton A. ECG Mastery: Black Belt Workshop. Advanced ECG interpretation. Medmastery
- Rawshani A. Clinical ECG Interpretation ECG Waves
- Smith SW. Dr Smith’s ECG blog.
- Wiesbauer F. Little Black Book of ECG Secrets. Medmastery PDF
Textbooks
- Zimmerman FH. ECG Core Curriculum. 2023
- Mattu A, Berberian J, Brady WJ. Emergency ECGs: Case-Based Review and Interpretations, 2022
- Straus DG, Schocken DD. Marriott’s Practical Electrocardiography 13e, 2021
- Brady WJ, Lipinski MJ et al. Electrocardiogram in Clinical Medicine. 1e, 2020
- Mattu A, Tabas JA, Brady WJ. Electrocardiography in Emergency, Acute, and Critical Care. 2e, 2019
- Hampton J, Adlam D. The ECG Made Practical 7e, 2019
- Kühn P, Lang C, Wiesbauer F. ECG Mastery: The Simplest Way to Learn the ECG. 2015
- Grauer K. ECG Pocket Brain (Expanded) 6e, 2014
- Surawicz B, Knilans T. Chou’s Electrocardiography in Clinical Practice: Adult and Pediatric 6e, 2008
- Chan TC. ECG in Emergency Medicine and Acute Care 1e, 2004
LITFL Further Reading
- ECG Library Basics – Waves, Intervals, Segments and Clinical Interpretation
- ECG A to Z by diagnosis – ECG interpretation in clinical context
- ECG Exigency and Cardiovascular Curveball – ECG Clinical Cases
- 100 ECG Quiz – Self-assessment tool for examination practice
- ECG Reference SITES and BOOKS – the best of the rest
ECG LIBRARY
Emergency Physician in Prehospital and Retrieval Medicine in Sydney, Australia. He has a passion for ECG interpretation and medical education | ECG Library |
BA MA (Oxon) MBChB (Edin) FACEM FFSEM. Emergency physician, Sir Charles Gairdner Hospital. Passion for rugby; medical history; medical education; and asynchronous learning #FOAMed evangelist. Co-founder and CTO of Life in the Fast lane | On Call: Principles and Protocol 4e| Eponyms | Books |