
![]()
Oxygen-Haemoglobin Dissociation Curve
OVERVIEW
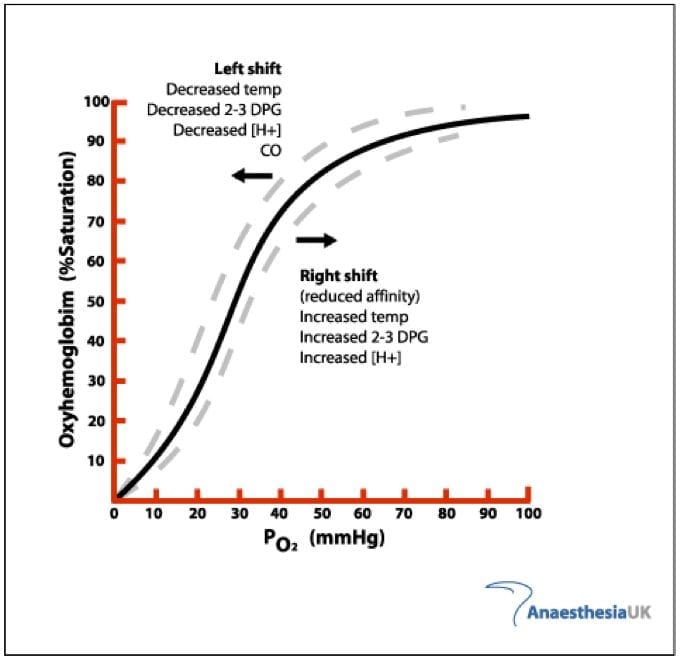
- sigmoid shape of the oxy-Hb dissociation curve results from the allosteric interactions of the globin monomers that make up the haemoglobin tetramer as each one binds O2
- multiple factors can affect the affinity of Hb for oxygen, thus causing the curve to shift to the left (increased oxygen affinity) or to the right (decreased O2 affinity)
OXY-HB DISSOCIATION CURVE
- pulmonary veins
PO2 95 -> SO2 97% - pulmonary arteries
PO2 40 -> SO2 75%
Table comparing SpO2 to PaO2
| SpO2 (%) | PaO2 (mmHg) |
| 97 | 95 |
| 92 | 60 |
| 89 | 50 |
| 75 | 40 |
| 50 | 27 |
- the amount of O2 bound to Hb is determined by the PO2 in a relationship termed the oxy-Hb dissociation curve.
- though atmospheric O2 concentration changes markedly, the buffering of Hb maintains constant tissue PO2.
Flat, upper portion of curve
-> if PO2 in alveolar falls, loading of O2 will be unaffected
-> a large partial pressure difference between blood & alveolar gas once most of gas has been transferred (diffusion hastened).
Middle, steep lower portion of curve
-> peripheral tissues can withdraw large amounts of O2 for a small drop in PO2 (assists O2 diffusion into tissue).
Utilization co-efficient = % of blood that gives up its O2 as it passes through tissue
- normal is 25%
- during exercise 75 to 85% (even higher)
FACTORS THAT SHIFT THE DISSOCIATION CURVE
Carbon monoxide
- interferes with O2 transport
- 240 x the affinity for Hb than O2 -> small amounts of CO can tie up large portions of Hb -> decreases O2 concentration
- oxy-Hb dissociation curve shifts to left -> favours uploading of O2
- can test for on co-oximetry
Temperature
- increased temperature shifts curve to right.
Carbon dioxide
- the Bohr effect
- high CO2 & H+ ion concentration
-> as O2 is given up in tissues
-> CO2 begins to bind & form carbonic acid
-> shifts curve to right
-> enhancing O2 off loading. - blood passing through lungs gives up CO2 & H+ ions in the form of carbonic acid
-> shifts O2 dissociation curve to left
-> quantity of O2 binding increases at any given PO2
-> increased O2 transport to tissues.
Hydrogen ion concentration
- see above
2,3 Diphosphoglycerate
- produced in response to hypoxia (after a few hours) or anaemia.
-> right shift in curve - formed in RBCs from 3-phosphoglyceraldehyde (a product of glycolysis)
- binds to the beta chains of deoxy Hb
- more O2 released into tissues, but also more difficult for O2 to bind with Hb in lungs.
- O2 released to tissues at as much as 10mmHg higher tissue O2 pressure than would be without increase in 2,3 DPG.
- in stored blood: 99% @ 7 days, 50% @ 14 days, 5% @ 28 days.
- can test for in blood
CLINICAL APPLICATION
- at present there is not enough data to support manipulation of O2-Hb curve to improve O2 delivery
- if arterial PO2 is critically low then O2 binding in the lungs may be impaired by a shift to the right -> this may seriously impair tissue oxygenation
References and Links
CCC Ventilation Series
Modes: Adaptive Support Ventilation (ASV), Airway Pressure Release Ventilation (APRV), High Frequency Oscillation Ventilation (HFOV), High Frequency Ventilation (HFV), Modes of ventilation, Non-Invasive Ventilation (NIV), Spontaneous breathing and mechanical ventilation
Conditions: Acute Respiratory Distress Syndrome (ARDS), ARDS Definitions, ARDS Literature Summaries, Asthma, Bronchopleural Fistula, Burns, Oxygenation and Ventilation, COPD, Haemoptysis, Improving Oxygenation in ARDS, NIV and Asthma, NIV and the Critically Ill, Ventilator Induced Lung Injury (VILI), Volutrauma
Strategies: ARDSnet Ventilation, Open lung approach, Oxygen Saturation Targets, Protective Lung Ventilation, Recruitment manoeuvres in ARDS, Sedation pauses, Selective Lung Ventilation
Adjuncts: Adjunctive Respiratory Therapies, ECMO Overview, Heliox, Neuromuscular blockade in ARDS, Prone positioning and Mechanical Ventilation
Situations: Cuff leak, Difficulty weaning, High Airway Pressures, Post-Intubation Care, Post-intubation hypoxia
Troubleshooting: Autotriggering of the ventilator, High airway and alveolar pressures / pressure alarm, Ventilator Dyssynchrony
Investigation / Indices: A-a gradient, Capnography and waveforms, Electrical Impedance Tomography, Indices that predict difficult weaning, PaO2/FiO2 Ratio (PF), Transpulmonary pressure (TPP)
Extubation: Cuff Leak Test, Extubation Assessment in ED, Extubation Assessment in ICU, NIV for weaning, Post-Extubation Stridor, Spontaneous breathing trial, Unplanned extubation, Weaning from mechanical ventilation
Core Knowledge: Basics of Mechanical Ventilation, Driving Pressure, Dynamic pressure-volume loops, flow versus time graph, flow volume loops, Indications and complications, Intrinsic PEEP (autoPEEP), Oxygen Haemoglobin Dissociation Curve, Positive End Expiratory Pressure (PEEP), Pulmonary Mechanics, Pressure Vs Time Graph, Pressure vs Volume Loop, Setting up a ventilator, Ventilator waveform analysis, Volume vs time graph
Equipment: Capnography and CO2 Detector, Heat and Moisture Exchanger (HME), Ideal helicopter ventilator, Wet Circuit
MISC: Sedation in ICU, Ventilation literature summaries
Journal articles
- Morgan TJ. The oxyhaemoglobin dissociation curve in critical illness. Crit Care Resusc. 1999 Mar;1(1):93-100. PubMed PMID: 16599868. [Free Full Text]
Critical Care
Compendium
Chris is an Intensivist and ECMO specialist at The Alfred ICU, where he is Deputy Director (Education). He is a Clinical Adjunct Associate Professor at Monash University, the Lead for the Clinician Educator Incubator programme, and a CICM First Part Examiner.
He is an internationally recognised Clinician Educator with a passion for helping clinicians learn and for improving the clinical performance of individuals and collectives. He was one of the founders of the FOAM movement (Free Open-Access Medical education) has been recognised for his contributions to education with awards from ANZICS, ANZAHPE, and ACEM.
His one great achievement is being the father of three amazing children.
On Bluesky, he is @precordialthump.bsky.social and on the site that Elon has screwed up, he is @precordialthump.
| INTENSIVE | RAGE | Resuscitology | SMACC

I was referred to this site by a respiratory therapist as we were discussing the meaning of changes in %Hb saturation as reported in President Donald Trump during his current hospitalization for Covid 19. I am an MD in specialty of Psychiatry. She linked me to an excellent presentation of the meaning of the oxy-Hb Dissociation Curve.
This is an excellent website to learn from and to use as a reference. I am a respiratory therapist and I definitely find it useful. Thank you for the fantastic content.
this is a very useful website to learn from .thank you for the fantastic content .i greatly appreciate