
![]()
VT versus SVT
Regular broad complex tachycardias can be ventricular (VT) or supraventricular (SVT with aberrancy) in origin, and differentiation between the two will significantly influence management of your patients.
Unfortunately, the electrocardiographic differentiation of VT from SVT with aberrancy is not always possible.
Differential diagnosis of regular broad complex tachycardia
- Ventricular tachycardia (VT)
- Supraventricular tachycardia (SVT) with aberrant conduction due to bundle branch block
- SVT with any metabolic disturbance that slows supraventricular action potential propagation — hyperkalaemia, sodium channel blockade, severe acidosis
- Antidromic AVRT — re-entrant tachyarrhythmia seen in Wolff-Parkinson-White syndrome
- Accelerated idioventricular rhythm (AIVR)
ECG features increasing the likelihood of VT
Electrocardiographic features that increase the likelihood of VT include:
Absence of typical RBBB or LBBB morphology
Extreme axis deviation (“northwest axis”): QRS positive in aVR and negative in I and aVF
Very broad complexes > 160ms
AV dissociation:
- P and QRS complexes at different rates
- P waves are often superimposed on QRS complexes and may be difficult to discern
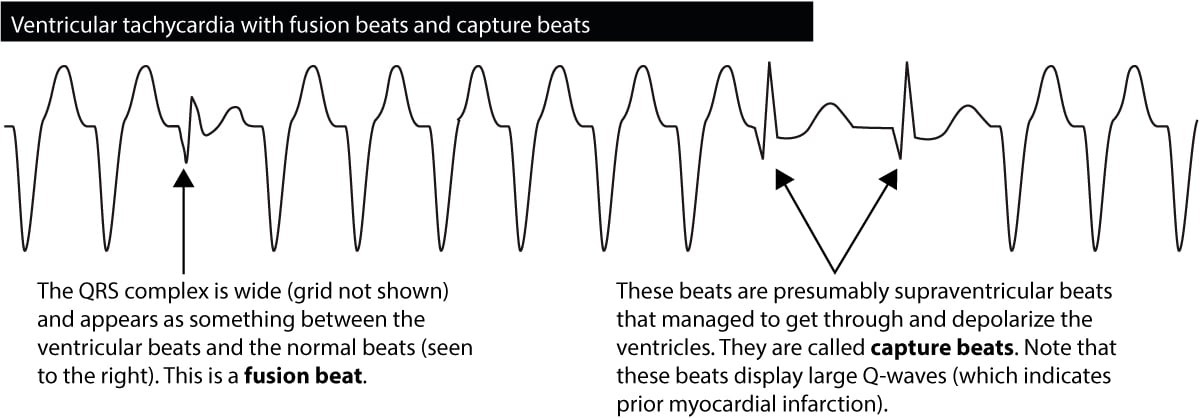
Capture beats: Occur when the sinoatrial node transiently “captures” the ventricles in the midst of AV dissociation, producing a QRS complex of normal duration
Fusion beats: Occur when a sinus and ventricular beat coincide to produce a hybrid complex (see Dressler beat)
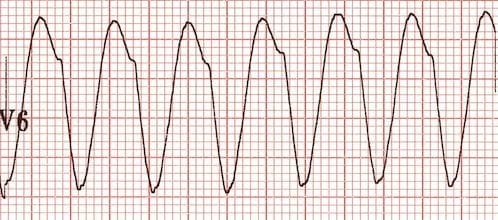
Positive concordance throughout the precordial leads:
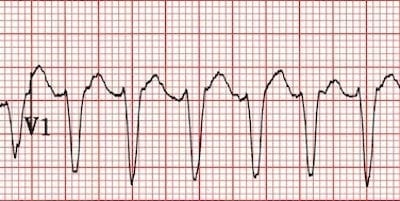
Negative concordance throughout the precordial leads:
RSR’ complexes with a taller left rabbit ear:
- This is the most specific finding in favour of VT
- This is in contrast to RBBB, where the right rabbit ear is taller
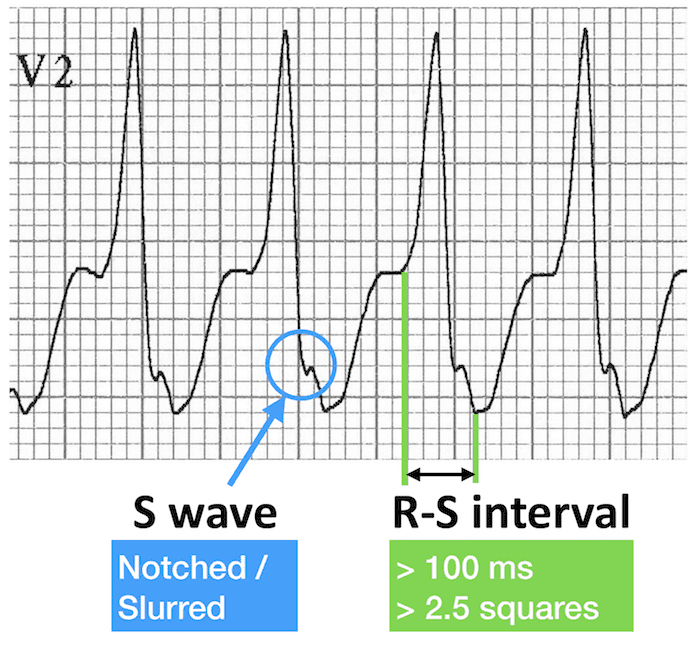
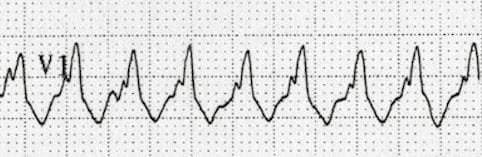
Brugada sign: Distance from onset of R wave to nadir of S wave is > 100ms in leads V1-6 (discussed further below)
Josephson sign: Notching/slurring near the nadir of the S wave
Clinical factors associated with VT or SVT
The likelihood of VT is increased with:
- Age > 35 (positive predictive value of 85%)
- Structural heart disease
- Ischaemic heart disease
- Previous MI
- Family history of sudden cardiac death (suggesting conditions such as HOCM, congenital long QT syndrome, Brugada syndrome or arrhythmogenic right ventricular dysplasia that are associated with episodes of VT)
The likelihood of SVT with aberrancy is increased if:
- Previous ECGs show a bundle branch block pattern with identical morphology to the broad complex tachycardia
- Previous ECGs show evidence of WPW (short PR < 120ms, broad QRS, delta wave)
- The patient has a history of paroxysmal tachycardias that have been successfully terminated with adenosine or vagal manoeuvres
Advanced Tips for Diagnosing VT — The Brugada Criteria
- For difficult cases, the Brugada algorithm can be used to distinguish between VT and SVT with aberrancy.
- The algorithm is followed from top to bottom — if any of the criteria are satisfied, then VT is diagnosed.

1. Absence of an RS complex in all precordial leads
This is essentially the same as having positive or negative concordance.
- All precordial leads consist of either monophasic R or S waves
- → VT is diagnosed
- If there are any RS complexes present in V1-6
- → go to step 2
Precordial R waves only → VT

Precordial S waves only → VT

RS complexes present → go to step 2
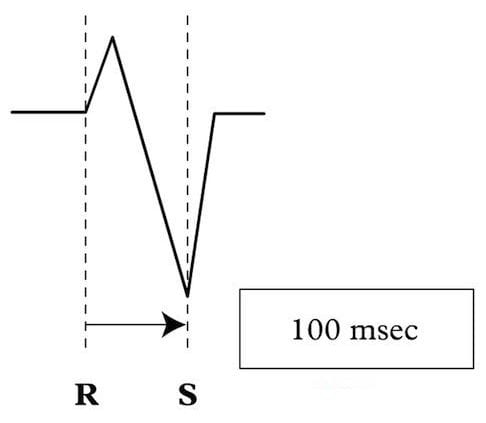
2. RS interval > 100ms in one precordial lead
If RS complexes are present in V1-6 then the RS interval is measured. This is the time from the onset of the R wave to the nadir of the S wave.
- If the RS interval is > 100 ms
- → VT
- If the RS interval is < 100 ms
- → go to step 3
3. AV dissociation
- P waves are present at a different rate to the QRS complexes
- → AV dissociation is present and VT is diagnosed.
- No evidence of AV dissociation can be seen
- → go to step 4
4. Morphological Criteria for VT
Leads V1-2 and V6 are assessed for characteristic features of VT. There are two sets of morphological criteria depending on the appearance of the QRS complex in V1:
- Dominant R wave in V1
- → see criteria for RBBB-like morphology
- Dominant S wave in V1
- → see criteria for LBBB-like morphology
Broad complex tachycardia with RBBB morphology
Appearance in V1-2
With a positive R wave in V1/V2, three patterns are indicative of VT:
- Smooth monophasic R wave
- Notched downslope to the R wave — the taller left rabbit ear
- A qR complex (small Q wave, tall R wave) in V1
NOTE: RSR’ pattern is suggestive of SVT with RBBB

Appearance in V6
In V6, the following patterns are consistent with VT:
- QS complex
- Completely negative complex with no R wave
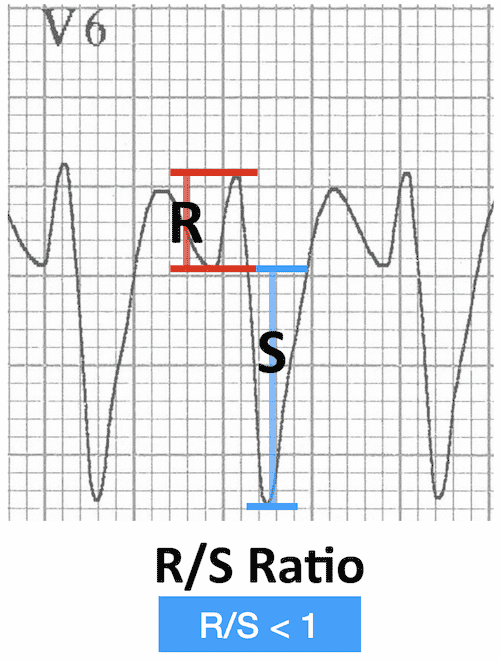
- R/S ratio < 1
- Small R wave, deep S wave
- Indicates VT only if LAD is also present
Broad complex tachycardia with LBBB morphology
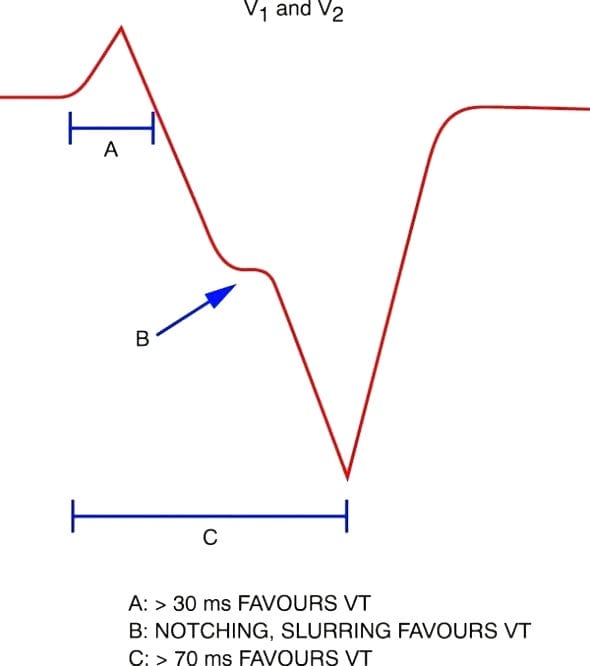
Appearance in V1-2
With a dominant S wave in V1, the following three features are diagnostic of VT:
- Initial R wave > 30-40 ms duration.
- Notching or slurring of the S wave (Josephson sign)
- RS interval (time from R wave onset to S wave nadir) > 60-70 ms
Appearance in V6
With a LBBB-like pattern, the presence of Q waves in V6 is indicative of VT.
There are two possible patterns of this:
- QS waves in V6 (as with RBBB-like patterns)
- → Very specific for VT
- qR complex in V6 (small q wave, large R wave)
- → VT
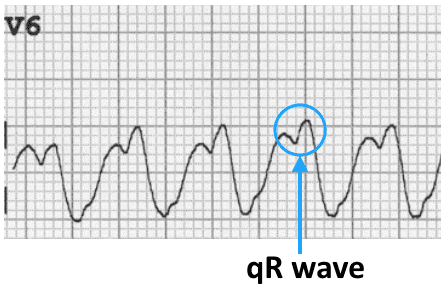
Note: SVT with LBBB is associated with absent Q waves in V6.

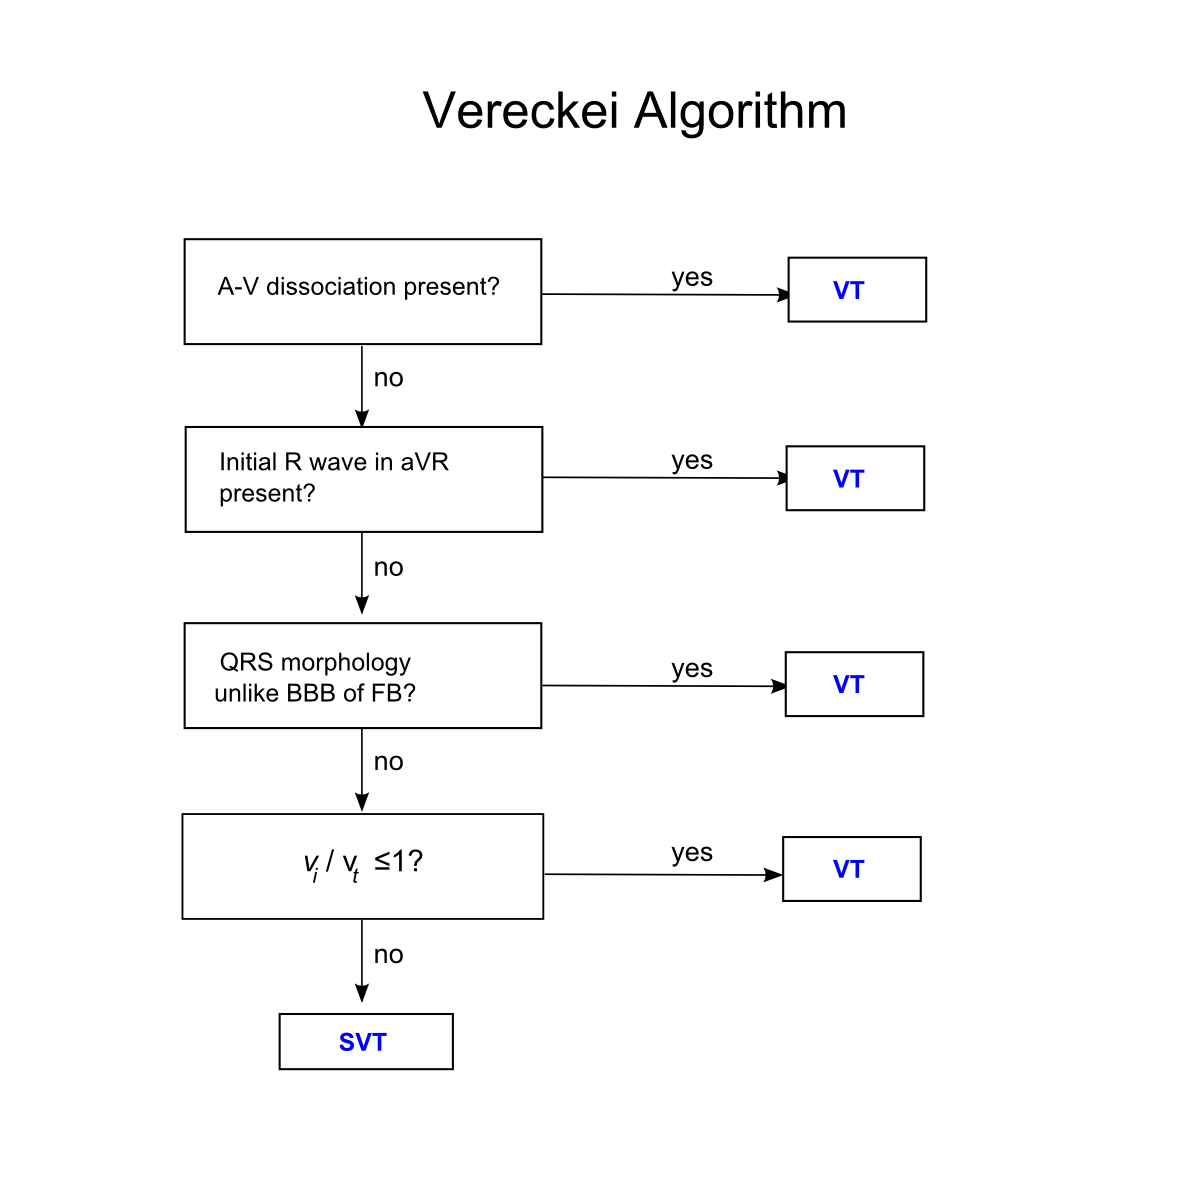
More Advanced Tips — The Vereckei Algorithm
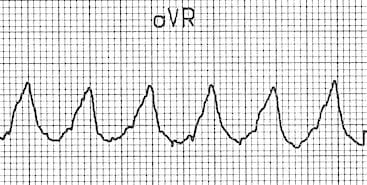
There is some overlap between the Vereckei and Brugada algorithms, but one of the most useful tips from the Vereckei algorithm is to examine the QRS complex in lead aVR. [PMID 18180024]
- Dominant initial R wave in aVR
- Indicative of VT
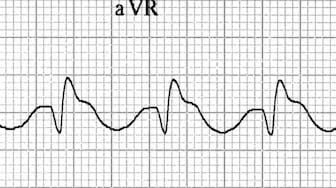
- Dominant terminal R’ wave in aVR (i.e. following a Q/S wave)
- More likely SVT with aberrancy
- Pattern is most commonly seen in TCA toxicity
Other diagnostic algorithms
Conclusions
- Most of the published criteria have high specificities but very low sensitivities (e.g. 20-50%) for diagnosing VT
- This means that even in the absence of diagnostic features for VT, there is no way to be 100% certain that the rhythm is SVT with aberrancy…
- If in doubt, treat as VT!
Broad Complex Tachycardia Quiz
Test your skills with these broad complex rhythms…
Example 1
Reveal answer
AV-nodal re-entry tachycardia (AVNRT) with LBBB
- Typical LBBB morphology with absence of Q waves in V6
- No positive Brugada criteria
- This patient had LBBB with identical morphology on their previous ECGs
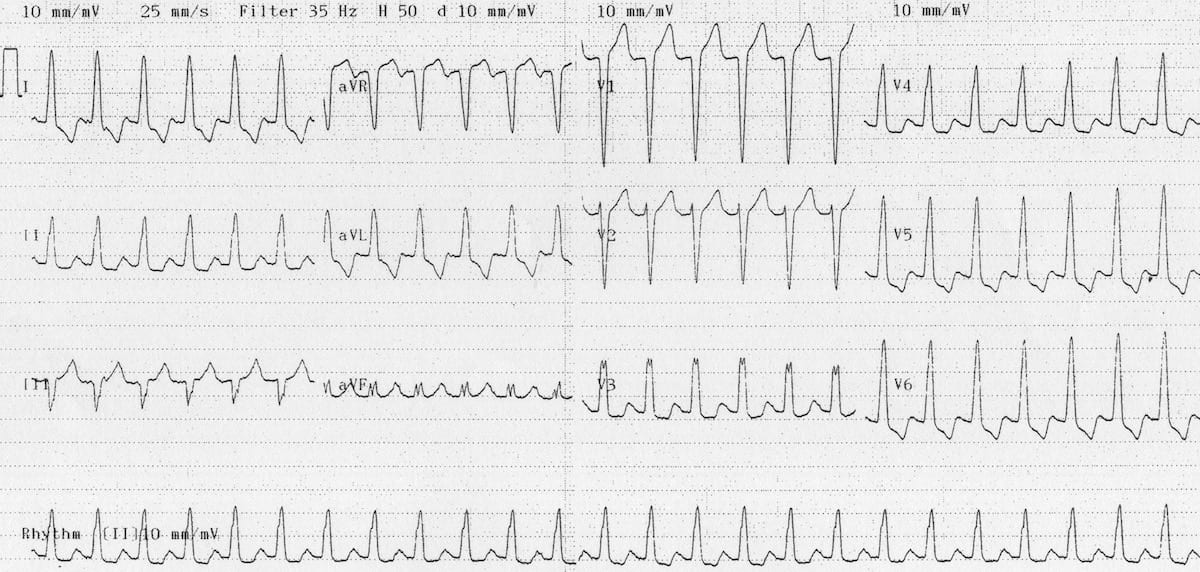
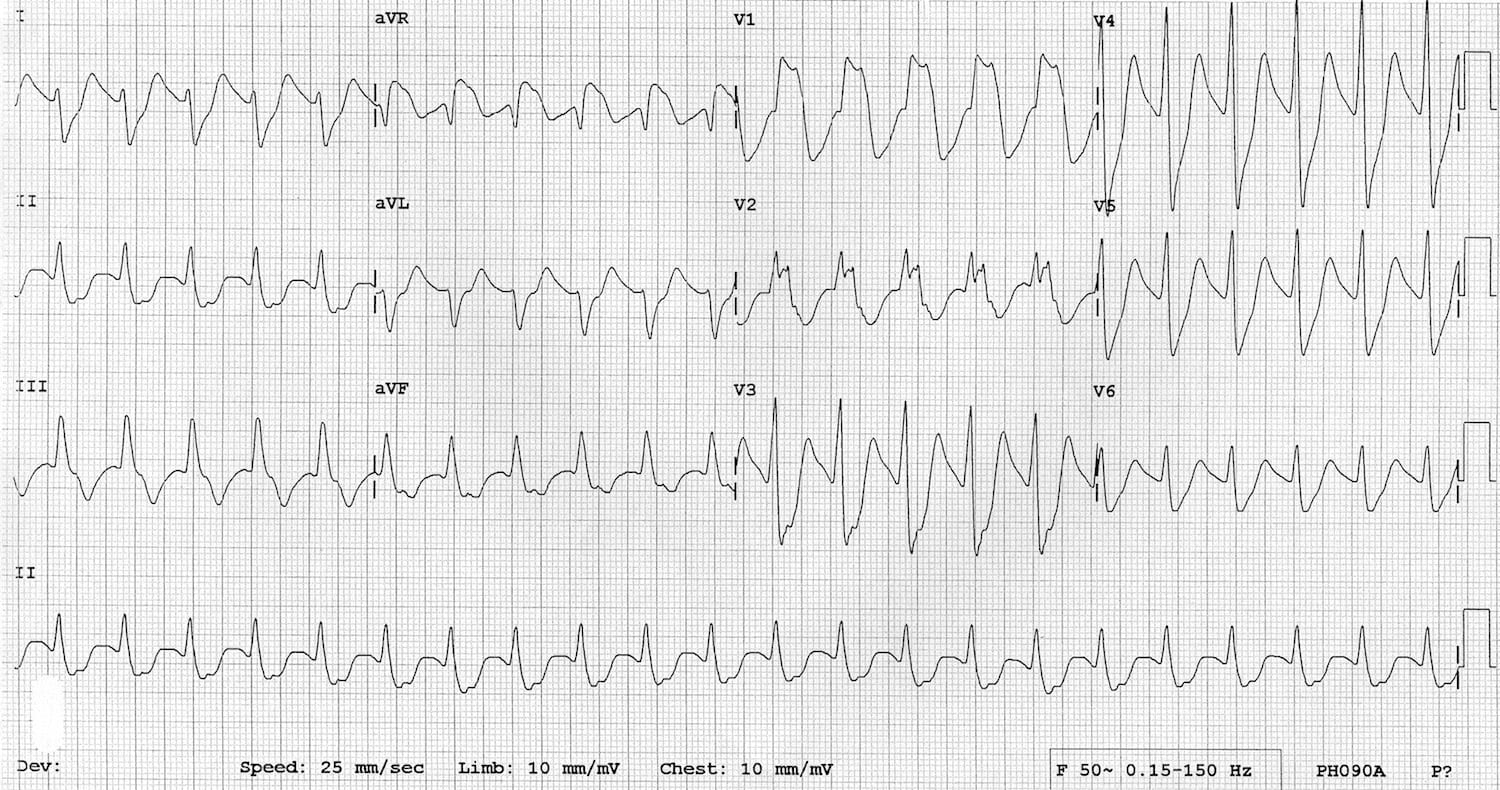
Example 2
Reveal answer
- This ECG is a difficult one!
- Although there is a broad complex tachycardia (HR > 100, QRS > 120), the appearance in V1 is more suggestive of SVT with aberrancy, given that the the complexes are not that broad (< 160 ms) and the right rabbit ear is taller than the left.
- However, on closer inspection there are signs of AV dissociation, with superimposed P waves visible in V1
- Also, the presence of a northwest axis and an R/S ratio < 1 in V6 (tiny R wave, deep S wave) indicate that this is VT
- This patient had a completely different QRS axis and morphology on his baseline ECG.
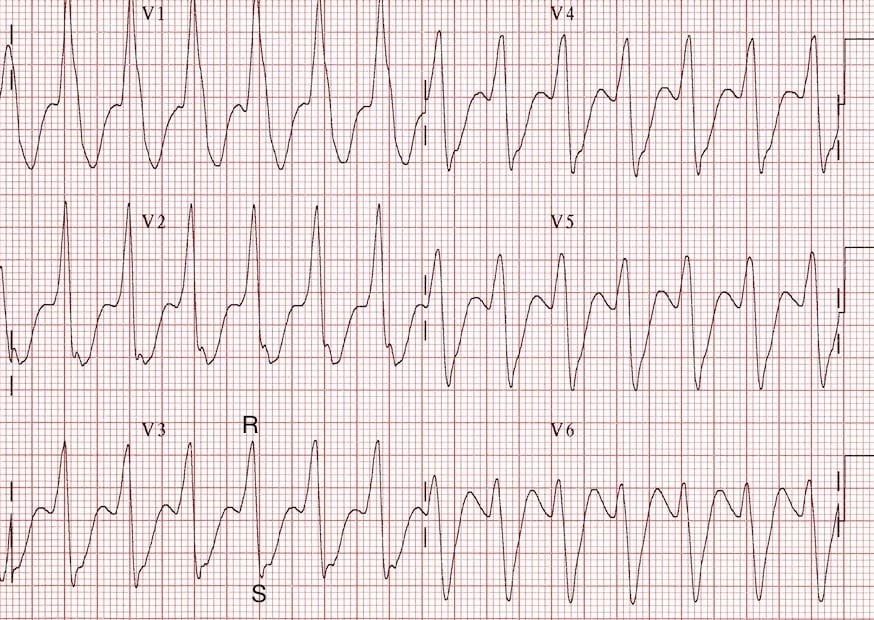
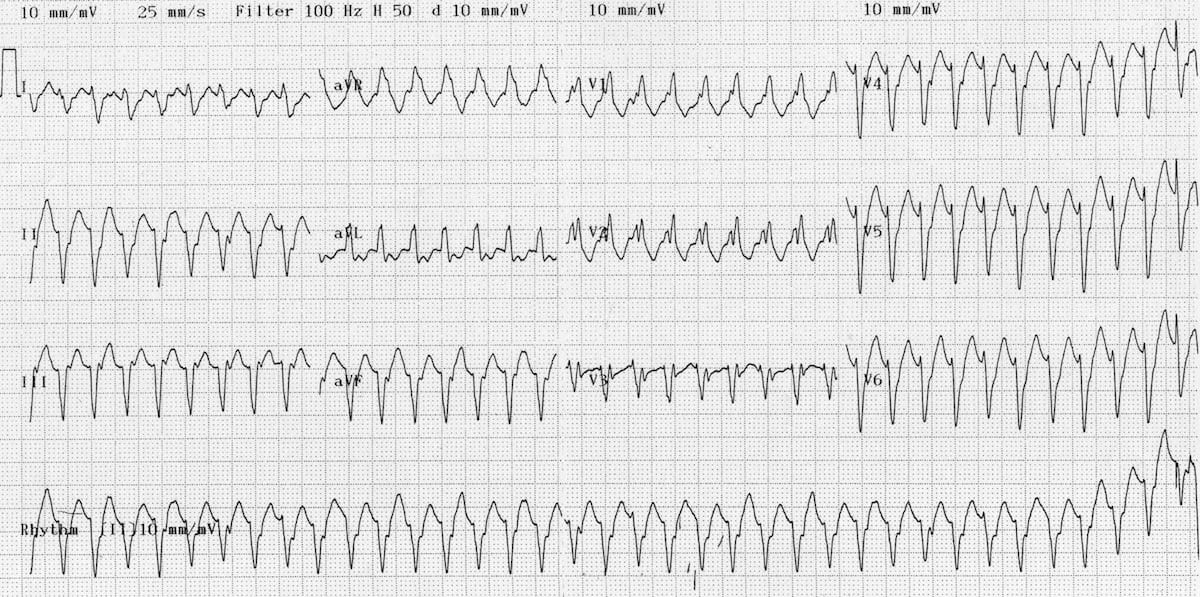
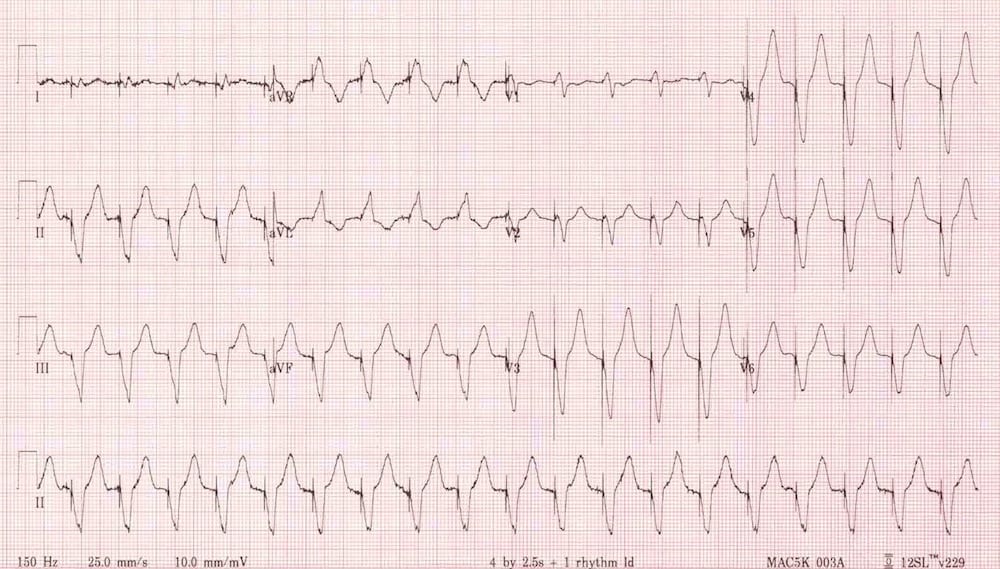
Example 3
Reveal Answer
Tricyclic antidepressant toxicity
- QRS complexes are very broad (~200ms) — however, unlike with VT most of the broadening is in the terminal portion of the QRS (this can be best appreciated in leads V3-V6 where narrow R waves are followed by massively broad and deep S waves)
- There are no positive Brugada criteria — in particular, the RS interval is < 100 ms.
- No P waves can be seen
The characteristic features of TCA toxicity are:
- Tachycardia — this is often a sinus tachycardia with a grossly prolonged PR interval, such that the P wave is hidden in the previous T wave or QRS complex; may be difficult to differentiate from junctional tachycardia with aberrant conduction.
- Broad QRS complexes.
- Right axis deviation of the terminal QRS — positive R’ wave in aVR, deep S wave in lead I.
Read more about TCA toxicity
Example 4
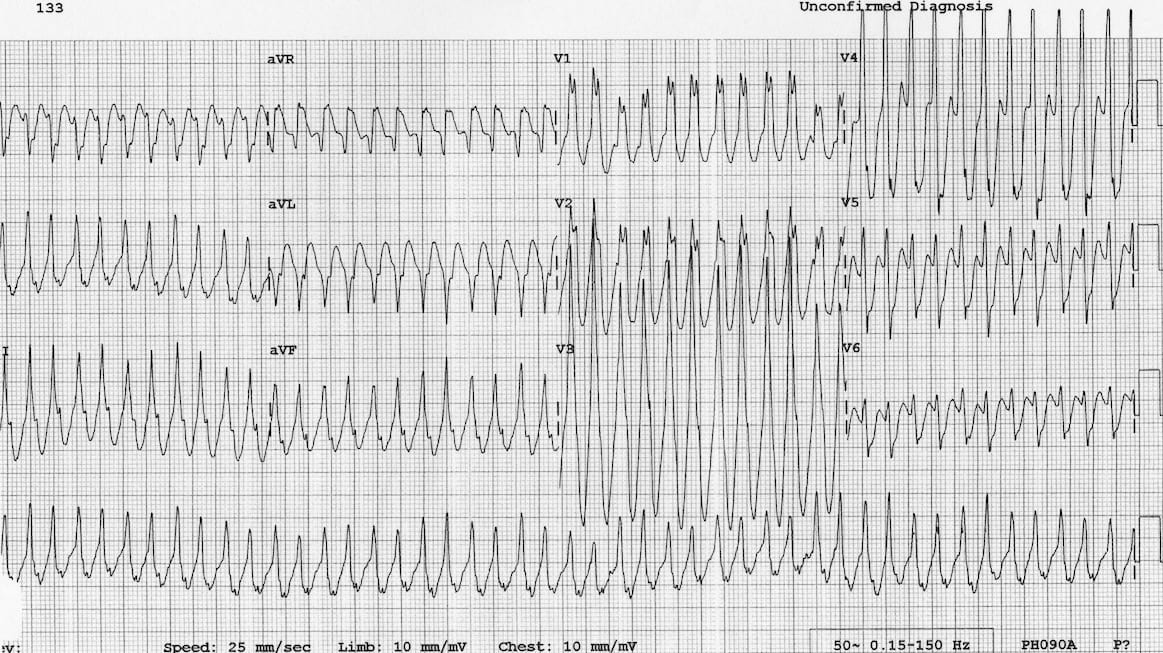
…Clue
The patient is 5 years old.
Reveal Answer
Antidromic atrioventricular re-entry tachycardia (AVRT) due to Wolff-Parkinson-White syndrome
- This is the one rhythm that may be impossible to distinguish from VT!
- In this case the main clue is the history — more than 95% of broad complex tachycardias in children are SVT with aberrancy
Read more about paediatric dysrhythmias
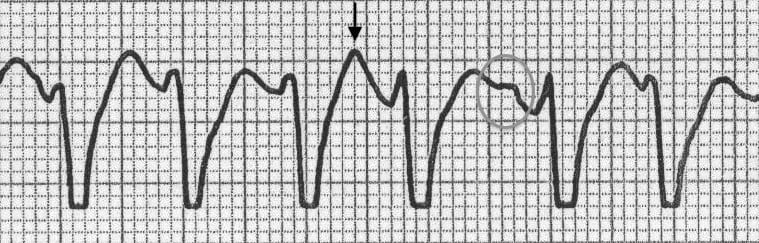
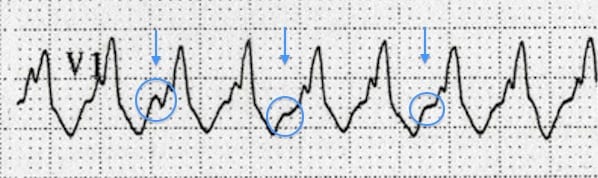
Example 5
Reveal Answer
Rapid ventricular paced rhythm (e.g. pacemaker-mediated tachycardia)
- There are obvious pacing spikes before each QRS complex
- Ventricular paced rhythms have features in common with other ventricular rhythms — in this case the ECG demonstrates negative concordance in V1-6, initial R wave > 40ms in V1, RS interval > 70 ms in V1, QS complex in V6
- Remember that the pacing spikes may not always be as obvious as this!
Read more about pacemaker dysfunctions
Further reading
- Read a detailed review article on VT versus SVT by ECG guru Prof Hein Wellens (of eponymous syndrome fame!)
- See some more ECG examples of ventricular tachycardia from the LITFL ECG library.
- ECG Top 100 – Clinical Case 046 (RBBB morphology)
- ECG Top 100 – Clinical Case 046 (LBBB morphology)
- ECG Exigency 004 – a case of broad complex tachycardia.
Related Topics
Read more about the different types of VT by following these links:
- Monomorphic VT
- Right Ventricular Outflow Tract Tachycardia
- Polymorphic VT / Torsades De Pointes
- Fasicular Tachycardia
- Bidirectional VT
- Ventricular Flutter
References
- Wellens HJ. Electrophysiology: Ventricular tachycardia: diagnosis of broad QRS complex tachycardia. Heart. 2001 Nov;86(5):579-85.
- Alzand BS, Crijns HJ. Diagnostic criteria of broad QRS complex tachycardia: decades of evolution. Europace. 2011 Apr;13(4):465-72.
- Brugada P, Brugada J, Mont L, Smeets J, Andries EW. A new approach to the differential diagnosis of a regular tachycardia with a wide QRS complex. Circulation. 1991 May;83(5):1649-59 [Brugada criteria]
- Josephson ME et al. Sustained ventricular tachycardia: role of the 12-lead electrocardiogram in localizing site of origin. Circulation. 1981 Aug;64(2):257-72 [Josephson sign]
- Kindwall KE, Brown J, Josephson ME. Electrocardiographic criteria for ventricular tachycardia in wide complex left bundle branch block morphology tachycardias. Am J Cardiol. 1988 Jun 1;61(15):1279-83 [Josephson sign]
- Vereckei A, Duray G, Szénási G, Altemose GT, Miller JM. Application of a new algorithm in the differential diagnosis of wide QRS complex tachycardia. Eur Heart J. 2007 Mar;28(5):589-600 [Vereckei algorithm]
- Vereckei A. Current algorithms for the diagnosis of wide QRS complex tachycardias. Curr Cardiol Rev. 2014 Aug;10(3):262-76
LITFL Further Reading
- ECG Library Basics – Waves, Intervals, Segments and Clinical Interpretation
- ECG A to Z by diagnosis – ECG interpretation in clinical context
- ECG Exigency and Cardiovascular Curveball – ECG Clinical Cases
- 100 ECG Quiz – Self-assessment tool for examination practice
- ECG Reference SITES and BOOKS – the best of the rest
Advanced Reading
- Brady WJ, Truwit JD. Critical Decisions in Emergency and Acute Care Electrocardiography
- Surawicz B, Knilans T. Chou’s Electrocardiography in Clinical Practice: Adult and Pediatric
- Wagner GS. Marriott’s Practical Electrocardiography 12e
- Chan TC. ECG in Emergency Medicine and Acute Care
- Rawshani A. Clinical ECG Interpretation
- Mattu A. ECG’s for the Emergency Physician
- Hampton JR. The ECG In Practice, 6e

ECG LIBRARY
Electrocardiogram
Emergency Physician in Prehospital and Retrieval Medicine in Sydney, Australia. He has a passion for ECG interpretation and medical education | ECG Library |

MBBS FACEM DDU (Emergency) CCPU. Emergency Physician in Melbourne, Australia. Co-Ultrasound Lead for Emergency Medicine at The Alfred Hospital. Special interests in diagnostic and procedural ultrasound, medical education, and ECG interpretation. Editor of the LITFL ECG Library.

[…] … Ejemplo de CONCORDANCIA POSITIVA en todas las precordiales = todos los complejos R, ausencia de complejo RS en todas las precordiales: CLIC AQUI […]
Congratulations for one more elusive post.
About the Brugada algorithm, you said that the first step (absence of RS) is the same as searching for concordance. But a VT may have absence of RS and still not be categorized as precordial concordance. For instance, in the presence of QR complexes. In Brugada’s original publication, figure 5 ilustrates 5 ecgs, and last one at the right is exactly the case.
So my question is, is absence of RS really a sinonym of precordial concordance?
Thanks a lot
[…] more detail and examples of VT vs SVT click here and feel free to comment […]
Please review your images of precordial concordance. The first one has what appear to be clearly negative QRS complexes in V1 & V2 where you claim this is positive concordance and the second one looks to have an rS in V6 where you claim there is Negative concordance without any rS complexes.
[…] more detail and examples of VT vs SVT click here and feel free to comment […]