![]()
Osborn Wave (J Wave)
Osborn Wave (J Wave) Overview
The Osborn wave (J wave) is a positive deflection seen at the J point in precordial and true limb leads. It is most commonly associated with hypothermia. These changes will appear as a reciprocal, negative deflection in aVR and V1.
The J point in the ECG is the point where the QRS complex joins the ST segment. It represents the approximate end of depolarization and the beginning of repolarization as determined by the surface ECG. There is an overlap of around 10ms.
The J point may deviate from the baseline in early repolarization, epicardial or endocardial ischemia or injury, pericarditis, RBBB, LBBB, RVH, LVH or digitalis effect.
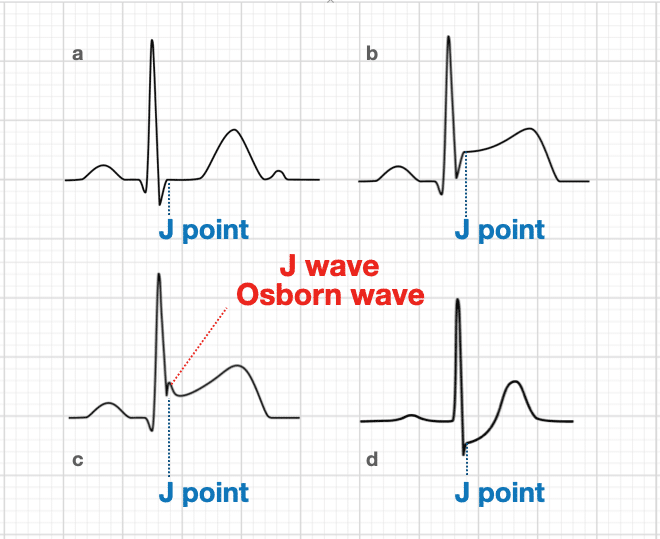
Note: The letter J on the ECG defines 2 totally different and unrelated events. The J point is a point in time marking the end of the QRS and the onset of the ST segment present on all ECGs. The J wave is a much less common, slow deflection of uncertain origin originally described in relation to hypothermia.
Osborn Wave Causes
Characteristically seen in hypothermia (typically T < 30C), but they are not pathognomic. Causes of non-hypothermic Osborn waves include:
- Hypercalcaemia [Otero et al]
- Acute myocardial ischaemia [Maruyama et al]
- Takotsubo cardiomyopathy [Zorzi et al]
- Left ventricular hypertrophy due to hypertension [Patel et al]
- Normal variant and early repolarization
- Neurological insults such as intracranial hypertension, severe head injury and subarachnoid haemorrhage
- Severe myocarditis
- Brugada syndrome [Bjerregaard et al]
- Le syndrome d’Haïssaguerre (idiopathic VF)
No definitive physiological cause for the deflection has been described, despite numerous postulates.
Compared to other hypothermia-induced ECG abnormalities (e.g. sinus bradycardia; supraventricular arrhythmias, QT prolongation and AV block), the Osborn wave is thought to be the most specific.
History
Eponymously associated with John Jay Osborn (1917-2014) following his 1953 ‘current of injury’ description in hypothermic dogs. See below for a deep dive into the eponymous history.
Osborn Wave ECG examples
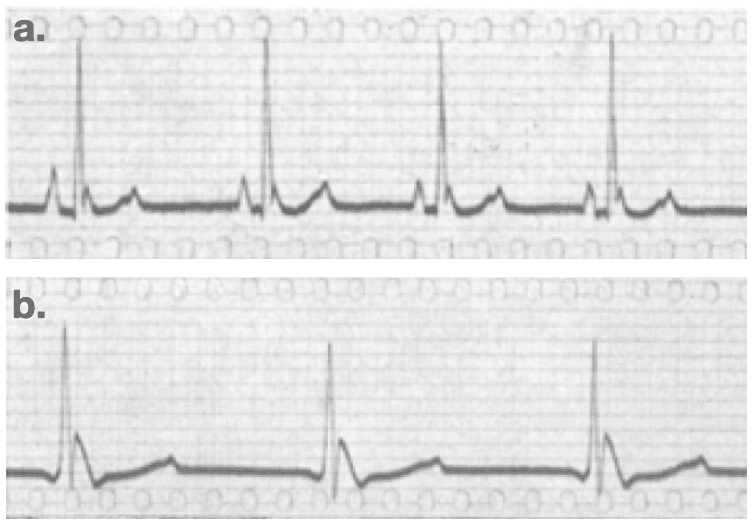
Example 1
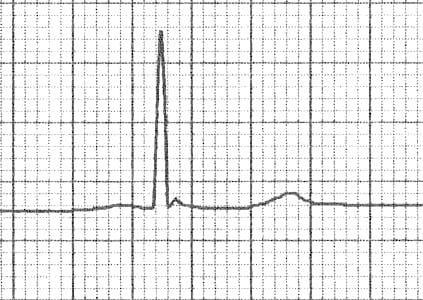
- Subtle J waves in mild hypothermia [Temp: 32.5°C (90.5°F)]
- The height of the J wave is roughly proportional to the degree of hypothermia
Example 2
- J waves in moderate hypothermia. [Temp: 30°C (86°F)]
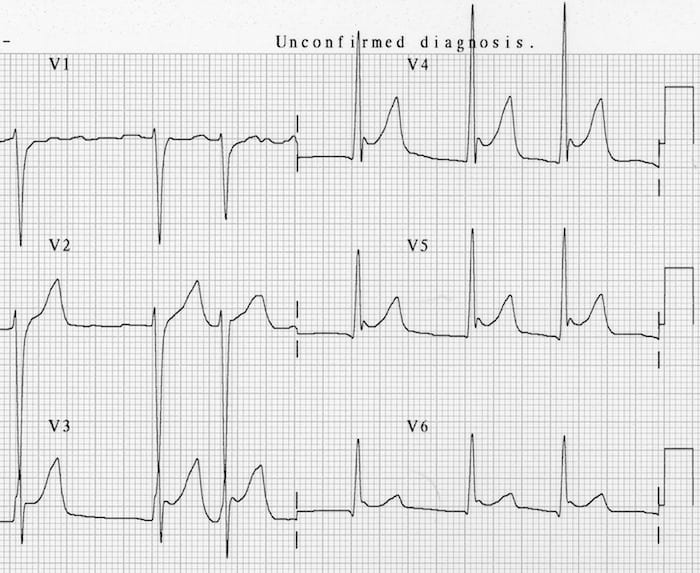
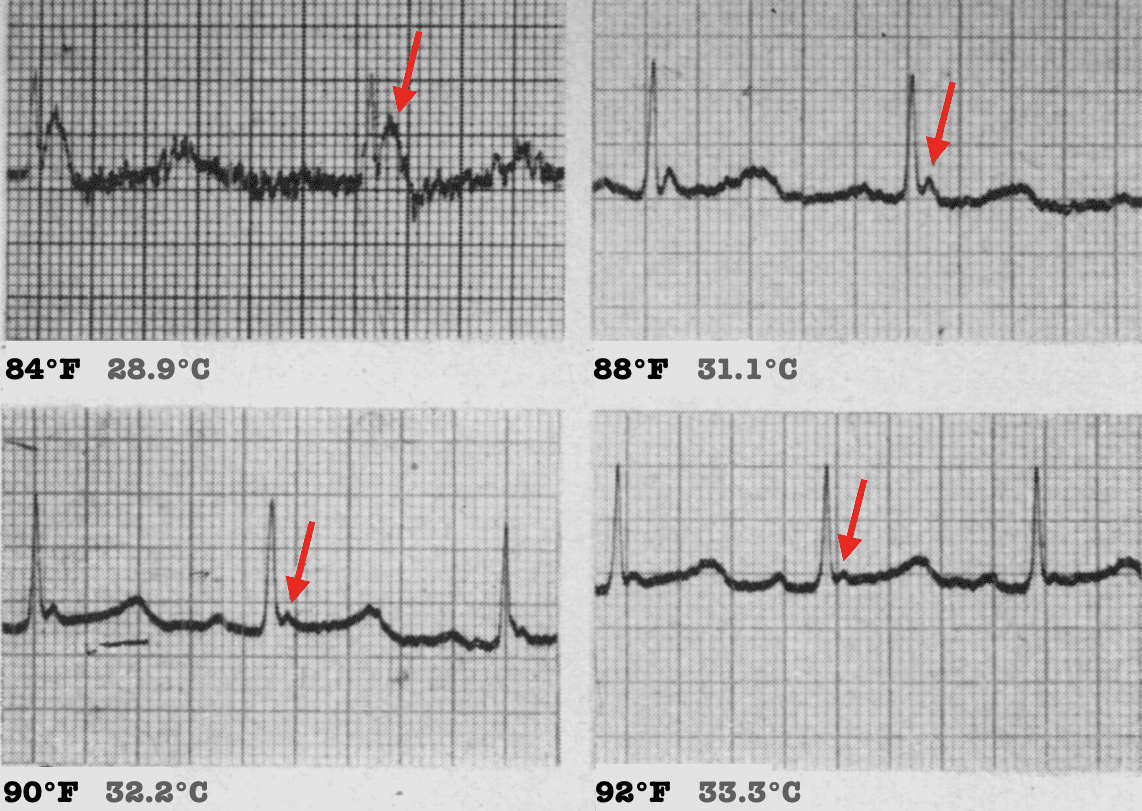
Example 3

- J waves in moderate hypothermia. [Temp: 28°C (82.4°F)]
Example 4
- J waves in severe hypothermia [Temp: 26°C (78.8°F)]
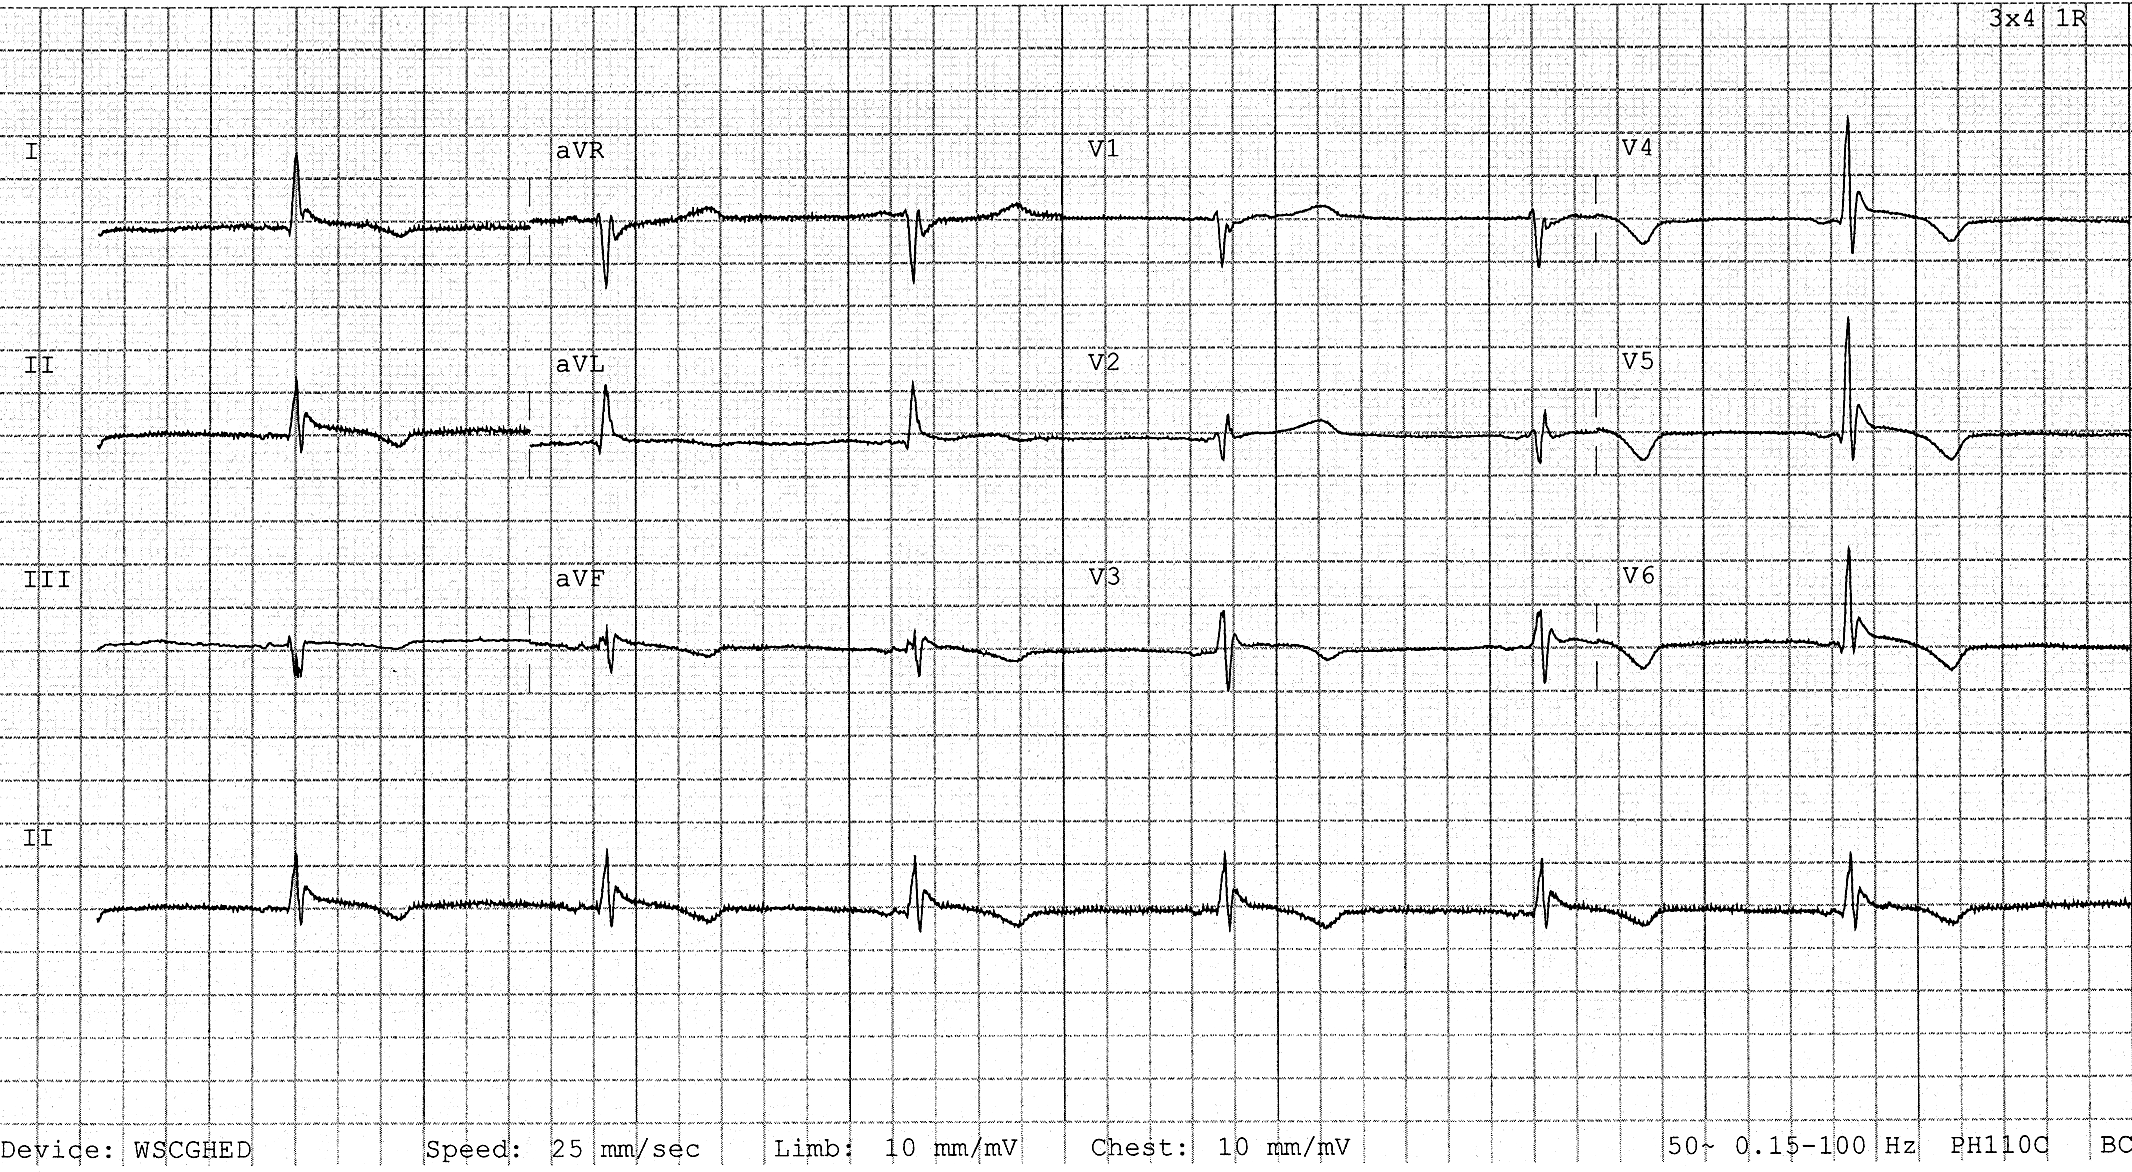
Example 5
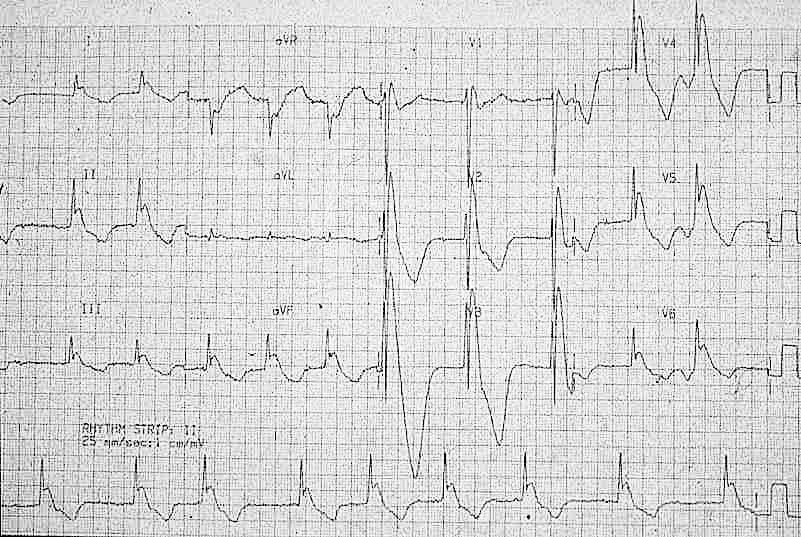
- Marked J waves in severe hypothermia [Temp: 26°C (78.8°F)]
- Note “negative” J waves seen in aVR and V1
Controversy regarding terminology
Occasionally you may encounter other terms used to describe Osborn waves (J waves). Some authors have used the term J wave deflection to describe such a large, prominent deviation of the J point from the baseline. Other terms used previously include the “late delta wave”, “J-point wave”, and the “camel-hump sign of Osborn“.
There is little consensus regarding terminology, nature, and prognostic significance of the J wave. In the setting of hypothermia, this phenomenon is most commonly referred to as an Osborn wave.
Eponymous History of the Osborn Wave
1922 – Kraus described a J-point deflection in hypercalcaemic conditions
1938 – Tomaszewski et al. provided the first description of hypothermic J wave in an accidentally frozen man. He described the J wave as a very slowly inscribed deflection between the QRS complex and the ST segment of the ECG, resembling a “domed T wave.”
…à côté de l’onde R on en voit une autre, ressemblant au T en dôme
Tomaszewski 1938
1943 – Grosse-Brockhoff and Schoedel studied the influence of hypothermia on different organ systems and they produced a specific ventricular conduction disorder, “aufsteigenden S-Schenkel eine deutliche Nachzacke” similar to the J wave in experiments with dogs. They noted that a widening of the secondary deflection on the QRS complex and supraventricular arrhythmias were accompanied by a parallel increase of carbon dioxide in alveolar air during body cooling.
Grosse-Brockhoff and Schoedel 1943
1950 – W.G. Bigelow et al described ECG changes in hypothermic dogs as:
…characterised by a doubling of the QRS interval, and lengthening of the QT interval by three to four times. The T-wave is long and irregular, and usually inverted.
Bigelow, 1950
1953 – Osborn studied the effect of hypothermia on the respiratory and cardiac function in dogs. Experimentally-induced hypothermia caused the development of a distinct deflection at the J point on the ECG and resulted in ventricular fibrillation. He called this deflection the ‘current of injury’.
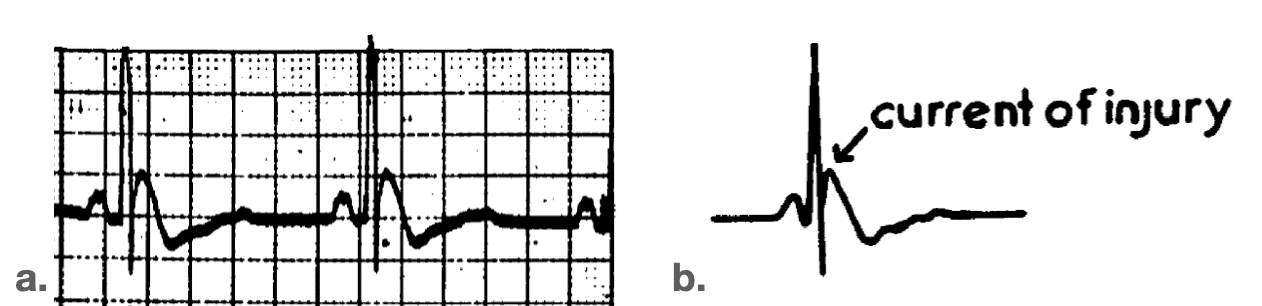
Fig 4. Electrocardiogram during hypothermia (lead II).
a. Hypothermic dog 7 min. before onset of ventricular fibrillation. Animal showed early alkalosis followed by acidosis. Rectal temp. 23’C, pulse 50.
b. Diagram of ECG shown in A, identifying current of injury.
Osborn JJ. Am J Physiol. 1953
Osborn considered acidaemia induced by hypothermia as a primary cause of the Osborn wave, because it disappeared if the arterial pH was normalized by hyperventilation during the same degree of cooling. He postulated:
…the ECG changes associated with hypothermia, particularly of the ‘current of injury’ type may not be associated with the low temperature directly, but rather may be more closely associated with faulty elimination of CO2 under hypothermic conditions
Osborn, 1953
1959 – Emslie-Smith et al found differences in the endocardial and epicardial responses of the ventricular myocardium to cold and proposed that a J wave, which is more prominent in epicardial than in endocardial leads, could be reflected in surface leads. They questioned the participation of acidosis in J wave genesis and the ability of this deflection to predict development of ventricular fibrillation.
The characteristic deflection of hypothermia has sometimes been named after Osborn who discussed it in 1953.
Emslie-Smith, 1959
1970 – Fernandez et al described a series of cases of hypothermia and re-warming. They noted the electrocardiographic features of hypothermia to include: bradycardia, nodal rhythm, atrial fibrillation, PR prolongation, second-degree heart block, QT interval prolongation, premature ventricular contractions and the J wave or “camel hump” (a term suggested by W. Procter Harvey, MD)
1994 – Patel et al presented eight normothermic patients whose 12-lead ECG demonstrated QRS-ST junction notches similar to those seen in hypothermia. J wave deflections were found in the settings of acute ischaemic events, cocaine use, haloperidol overdose, and left ventricular hypertrophy due to hypertension. They concluded that the Osborn wave is not pathognomonic of hypothermia.
1996 – Yan and Antzelevitch provide the first direct evidence in support of the hypothesis that heterogeneous distribution of a transient outward current-mediated spike-and-dome morphology of the action potential across the ventricular wall underlies the manifestation of the electrocardiographic J wave. The presence of a prominent action potential notch in epicardium but not endocardium is shown to provide a voltage gradient that manifests as a J (Osborn) wave or elevated J-point in the ECG.
Over the years it has been increasingly common for clinicians to label the J-wave deflection seen in hypothermia as an Osborn wave.
Clinical Cases
References
Historical articles
- Kraus F. Ueber die Wirkung des Kalziums auf den Kreislauf. Deutsche medizinische Wochenschrift. 1920; 46: 201–203.
- Kraus F, Zondek SG. Uber die Durchtrankungsspannung. Klinische Wochenschrift. 1922; 36: 1778-1779.
- Tomaszewski W. Changements electrocardiographiques observes chez un homme mort de froid. Archives des Maladies du Coeur et des Vaisseaux. 1938; 31: 525-528
- Grosse-Brockhoff F, Schoedel W. Das Bild der akuten Unterkühlung im Tierexperiment. Archiv für experimentelle Pathologie und Pharmakologie 1943; 201: 417-442
- Juvenelle A, Lind J, Wegelius C. Quelques possibilités offertes par l’hypothermie générale profonde provoquée: une étude expérimentale chez le chien. Presse Med. 1952;60:973–978.
- Bigelow WG, Lindsay WK, Greenwood WF. Hypothermia; its possible role in cardiac surgery: an investigation of factors governing survival in dogs at low body temperatures. Ann Surg. 1950 Nov; 132(5): 849-66.
- Osborn JJ. Experimental hypothermia; respiratory and blood pH changes in relation to cardiac function. Am J Physiol. 1953 Dec; 175(3): 389-98.
- Emslie-Smith D, Sladden GE, Stirling GR. The significance of changes in the electrocardiogram in hypothermia. Br Heart J. 1959 Jul;21(3):343-51.
- Yan GX, Antzelevitch C. Cellular basis for the electrocardiographic J wave. Circulation. 1996 Jan 15;93(2):372-9
Review articles
- Patel A, Getsos JP, Moussa G, Damato AN. The Osborn wave of hypothermia in normothermic patients. Clin Cardiol. 1994 May;17(5):273-6.
- Gussak I, Bjerregaard P, Egan TM, Chaitman BR. ECG phenomenon called the J wave. History, pathophysiology, and clinical significance. J Electrocardiol. 1995 Jan;28(1):49-58.
- Yan GX, Antzelevitch C. Cellular basis for the electrocardiographic J wave. Circulation. 1996 Jan 15;93(2):372-9.
- Hurst JW. Abnormalities of the S-T segment – Part I. Clin Cardiol. 1997 Jun;20(6):511-20.
- Hurst JW. Abnormalities of the S-T segment – Part II. Clin Cardiol. 1997 Jul;20(7):595-600.
- Hurst JW. Naming of the waves in the ECG, with a brief account of their genesis. Circulation. 1998 Nov 3;98(18):1937-42
- Otero J, Lenihan DJ. The “normothermic” Osborn wave induced by severe hypercalcemia. Tex Heart Inst J. 2000;27(3):316-7.
- Maruyama M, Kobayashi Y, Kodani E, Hirayama Y, Atarashi H, Katoh T, Takano T. Osborn waves: history and significance. Indian Pacing Electrophysiol J. 2004 Jan 1;4(1):33-9
- Shinde R, Shinde S, Makhale C, Grant P, Sathe S, Durairaj M, Lokhandwala Y, Di Diego J, Antzelevitch C. Occurrence of “J waves” in 12-lead ECG as a marker of acute ischemia and their cellular basis. Pacing Clin Electrophysiol. 2007 Jun;30(6):817-9.
- Haïssaguerre M, et al. Sudden cardiac arrest associated with early repolarization. N Engl J Med. 2008 May 8;358(19):2016-23.
- Otero J, Lenihan DJ. The “normothermic” Osborn wave induced by severe hypercalcemia. Tex Heart Inst J. 2000;27(3):316-7.
- Omar HR. The Osborn wave: what have we learned? Herz. 2016 Feb;41(1):48-56.
- Buttner R. Osborn wave. Eponym A Day. Instagram
- Cadogan M. History of the Electrocardiogram. LITFL
- ST Segment
- R Wave
- T Wave
- U Wave
- Osborn Wave
- Epsilon Wave
- Delta Wave
Advanced Reading
Online
- Wiesbauer F, Kühn P. ECG Mastery: Yellow Belt online course. Understand ECG basics. Medmastery
- Wiesbauer F, Kühn P. ECG Mastery: Blue Belt online course: Become an ECG expert. Medmastery
- Kühn P, Houghton A. ECG Mastery: Black Belt Workshop. Advanced ECG interpretation. Medmastery
- Rawshani A. Clinical ECG Interpretation ECG Waves
- Smith SW. Dr Smith’s ECG blog.
- Wiesbauer F. Little Black Book of ECG Secrets. Medmastery PDF
Textbooks
- Zimmerman FH. ECG Core Curriculum. 2023
- Mattu A, Berberian J, Brady WJ. Emergency ECGs: Case-Based Review and Interpretations, 2022
- Straus DG, Schocken DD. Marriott’s Practical Electrocardiography 13e, 2021
- Brady WJ, Lipinski MJ et al. Electrocardiogram in Clinical Medicine. 1e, 2020
- Mattu A, Tabas JA, Brady WJ. Electrocardiography in Emergency, Acute, and Critical Care. 2e, 2019
- Hampton J, Adlam D. The ECG Made Practical 7e, 2019
- Kühn P, Lang C, Wiesbauer F. ECG Mastery: The Simplest Way to Learn the ECG. 2015
- Grauer K. ECG Pocket Brain (Expanded) 6e, 2014
- Surawicz B, Knilans T. Chou’s Electrocardiography in Clinical Practice: Adult and Pediatric 6e, 2008
- Chan TC. ECG in Emergency Medicine and Acute Care 1e, 2004
LITFL Further Reading
- ECG Library Basics – Waves, Intervals, Segments and Clinical Interpretation
- ECG A to Z by diagnosis – ECG interpretation in clinical context
- ECG Exigency and Cardiovascular Curveball – ECG Clinical Cases
- 100 ECG Quiz – Self-assessment tool for examination practice
- ECG Reference SITES and BOOKS – the best of the rest
ECG LIBRARY
BA MA (Oxon) MBChB (Edin) FACEM FFSEM. Emergency physician, Sir Charles Gairdner Hospital. Passion for rugby; medical history; medical education; and asynchronous learning #FOAMed evangelist. Co-founder and CTO of Life in the Fast lane | On Call: Principles and Protocol 4e| Eponyms | Books |

MBBS FACEM DDU (Emergency) CCPU. Emergency Physician in Melbourne, Australia. Co-Ultrasound Lead for Emergency Medicine at The Alfred Hospital. Special interests in diagnostic and procedural ultrasound, medical education, and ECG interpretation. Editor of the LITFL ECG Library.