![]()
History of the Electrocardiogram
Eponymythology: The myths behind the history
A brief (…and frequently updated) history of the ECG and electrocardiography and the eponymous names behind the ECG/EKG…
1775 – Peter Christian Abildgaard (1740-1801), a Danish veterinarian and physician demonstrated in Tentamina electrica in animalibus instituta. Societatis Medicae Havniensis Collectanea. 1775; 2: 157-161, that
...with a shock to the head, [a hen] was rendered lifeless, and arose with a second shock to the chest; however, after the experiment was repeated rather often, the hen was completely stunned, walked with some difficulty, and did not eat for a day and night; then later it was very well and even laid an egg.
Translation: Driscol et al 1975
1786 – Luigi Galvani (1737-1798) was an Italian obstetrician, surgeon and anatomist who demonstrated that direct contact with the electrical generator or the ground through an electrical conductor would lead to a muscle contraction in a frog’s leg. In a separate experiment he attached brass hooks suspended from an iron railing in his garden, to the frog’s spinal cord. He noted the frogs legs twitched during lightening storms but also when the weather was fine and interpreted these results in terms of ‘animal electricity’ and the preservation of ‘nerveo-electrical fluid’ similar to that of the electric eel. [De viribus Electritatis in motu musculari Commentarius – 1791]
1867 – Richard Payne Cotton (1820-1877) documented a patient with a heart rate of 232 bpm using a sphygmograph, one of the first graphic tracings of paroxysmal tachycardia.
1873 – The capillary electrometer was devised by Gabriel Lippmann (1845–1921). It consisted of a glass tube containing mercury with one end drawn out into a fine capillary (20 to 30 mµ) and immersed vertically in dilute sulfuric acid. Measurement is based on displacement of the mercury meniscus because mercury contracts and expands according to the potential difference between the mercury and acid which are connected to electrodes on 2 points on the body.
1873 – Luigi Luciani (1840-1919) demonstrated cardiac group beating (which he named periodic rhythm) and recorded 2nd degree AV blocks whilst studying frogs hearts in Carl Ludwig’s laboratory in Leipzig. Wenckebach later credited Luciani with this discover, referring to the phenomena as ‘Luciani periods‘. With the advent of the ECG, this form of group beating became known as ‘Wenckebach periodicity‘. [Eine periodische Function des isolirten Froschherzens (A periodic function of the isolated frog heart) 1873; 25: 11–94]
1873 – Alfred Lewis Galabin (1843 – 1913) was the first to demonstrate atrioventricular block in humans. He used the apexcardiogram to study patients with mitral stenosis, and found a patient with a slow pulse – the case report in which he described atrial contraction asynchronous with ventricular contraction. Subsequent analysis of Galabin’s laddergrams insinuate the patient had advanced AV block with 3-to-1 and 2-to-1 AV conduction with Wenckebach periodicity. [On the causes of the secondary waves seen in the sphygmographic tracing of the pulse. J Anat Physiol 1873;8:1–22;112.]
1887 – Augustus D Waller defined the term and demonstrated the first ‘electrocardiogram‘, a tracing from the intact human heart recorded using a mercury capillary electrometer and a toy train at St. Mary’s Hospital, London (in the presence of Einthoven). The tracing revealed only 2 deflections which he labeled V1 and V2 to indicate ventricular events. [A Demonstration on Man of Electromotive Changes accompanying the Heart’s Beat. Journal of Physiology 1887;8:229-34]

1893 – Dutch physician and physiologist Willem Einthoven (1860 – 1927) introduces the term ‘electro-cardiogrammem’ at a meeting of the Dutch Medical Association [Nieuwemethoden voor clinisch onderzoek [New methods for clinical investigation]. Nederlands Tijdschrift voor Geneeskunde. 1893; 29(II): 263-286]
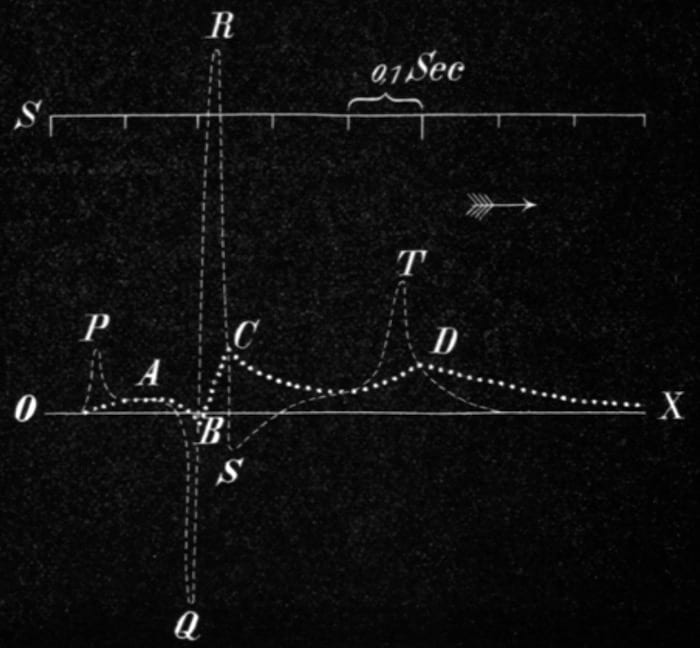
1895 – Einthoven derived a correction formula that compensated for the inertia and friction when using the mercury column of the Lippmann capillary electrometer. Einthoven superimposed the mathematically corrected curve on the uncorrected curve. He had previously used ABCD to indicate the waves in the uncorrected tracing, and was forced to find other letters to label his corrected curve.
Einthoven labeled the corrected derived deflections PQRS and T. The choice of letters is still debated, but most likely based on a mathematical convention dating from Descartes starting with the letter P to identify successive points on a curve. [Einthoven W. Ueber die Form des menschlichen Electrocardiogramms. Archiv für die gesamte Physiologie des Menschen und der Tiere. 1895; 60 (3-4): 101-123.]
1899 – Karel Frederik Wenckebach (1864 – 1940) demonstrated impairment of AV conduction leading to progressive lengthening and blockage of AV conduction in frogs. Now known as Wenckebach block or Mobitz type I. Wenckebach KF. Zur Analyse des unregelmässigen Pulses [On the analysis of irregular pulses] Zeitschrift Für Klinische Medizin. [I 1899; 36: 181-199] [II 1899; 37: 475–488] [III 1900; 39: 293-305] [IV 1902: 44: 218-225]
Wenckebach credited Luigi Luciani (1840 – 1919) as the first to describe this recurrent pattern in his 1873 frog heart experiments and defined this form of group beating as ‘Luciani’schen Perioden’ (Luciani periods)
Man spricht in diesen Fällen von einer “periodischen Function” des Herzens; die Gruppen werden nach dem Entdecker “Luciani’sche Perioden” genannt…[In these cases one speaks of a “periodic function” of the heart; the groups are called “Luciani periods” after the discoverer]
Wenckebach 1899; 37: 478
1900 – First article source using the term Elektrokardiogramm (EKG) Einthoven W, de Lint K. Ueber das normale menschliche Elektrokardiogramm und über die capillar-elektrometrische Untersuchung einiger Herzkranken. Archiv für die gesamte Physiologie des Menschen und der Tiere. 1900; 80: 139–160.
1901 – Einthoven invents the Saitengalvanometer (string galvanometer) using a fine quartz string coated in silver (rather than the wire coated string of Deprez and d’Arsonval). [Einthoven W. Un nouveau galvanomètre. Archives Neerlandaises des sciences exactes et naturelles 1901; 6: 625-633.]
1902 – Einthoven published the first ECG in his article Galvanometrische registratie van het menschelijk electrocardiogram in: Herinneringsbundel Prof. S.S. Rosenstein. 1902: 101-106
1905 – Einthoven provides the first organised presentation of normal and abnormal electrocardiograms recorded with his string galvanometer and recording apparatus in his laboratory. He presented cases of atrial and ventricular hypertrophy; ventricular bigeminy, ventricular premature beats and he introduced the U wave… Of note the electrocardiograms recorded had been transmitted via telephone wire from the patients in a hospital some distance 1500m away! The first of these telecardiogram’s was sent and recorded on March 22nd 1905. [Le Télécardiogramme. Archives internationales de physiologie. 1906;4:132-164]
1906 – John Hay (1873 – 1959) kymographically recorded simultaneous jugular venous and radial arterial pulses of a 65-year-old man with a slow pulse in which AV conduction did not seem to be impaired since the ac intervals on the jugular venous waves was unchanged in the conducted beats. Now known as Mobitz type II AV block. [Bradycardia and cardiac arrhythmia produced by depression of certain of the functions of the heart. Lancet 1906;167(4299):139-143]
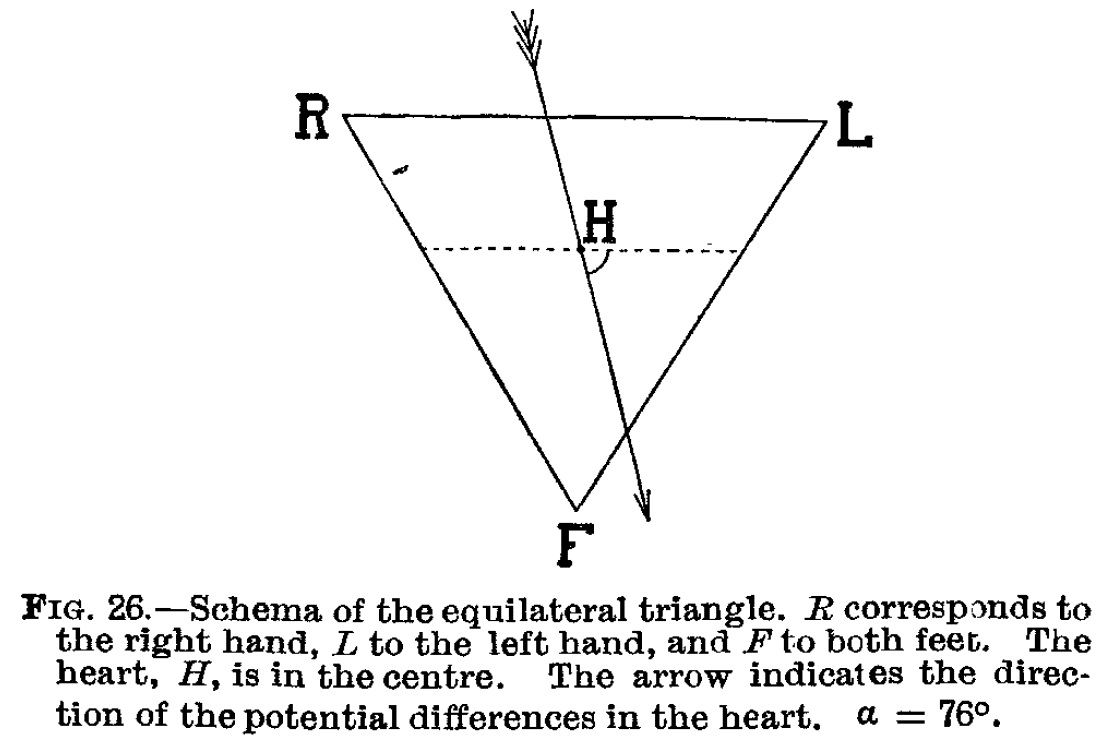
1912 – At an address to the Chelsea Clinical Society on March 19th 1912, Einthoven outlined his schema of the equilateral triangle formed by his standard leads I, II and III (Einthoven triangle) [The different forms of the human electrocardiogram and their signification. Lancet 1912; 179(4622): 853-861.]
Interestingly, in this address the term electrocardiogram and the abbreviation EKG are used, with no reference to the abbreviation ECG
It gives me an especial pleasure to bring to remembrance here that the human EKG. was first recorded by a London physiologist, Augustus D. Waller, who also introduced the term “electrocardiogram” into science; and that Dr. Thomas Lewis, whose extensive researches have been crowned with such exceptional success, was the first man in England who applied electrocardiography to clinical investigations.
Einthoven 1912
1913 – Sir Thomas Lewis (1881 – 1945) developed his Lewis lead (S5-lead) electrode configuration to help detect atrial activity and its relationship to ventricular activity. It is useful in observing flutter waves in atrial flutter; and detecting P waves in wide complex tachyarrhythmia to identify atrioventricular dissociation. [Auricular fibrillation. In: Clinical Electrocardiography. 1913: 86-97]
1920 – QT interval correction (QTc). Louis Sigurd Fridericia (1881 – 1947) Fridericia found that the duration of the QT interval was related to the cube root of the RR interval (Fridericia formula) – independent of the relationship defined in 1920 by Henry Cuthbert Bazett (1885 – 1950) where he related the corrected QT interval to the square root of the RR interval (Bazett formula)
1924 – Woldemar Mobitz (1889 – 1951) applied a mathematical approach to analyzing arrhythmias by graphing the relationship of changing atrial rates and premature beats to AV conduction. He reviewed the works of Wenckebach and Hay to produce his classification of Second-degree AV block in his paper Über die unvollständige Störung der Erregungs-überleitung zwischen Vorhof und Kammer des menschlichen Herzens [On the partial block of impulse conduction between atrium and ventricle of human hearts] in Zeitschrift Fur Die Gesamte Experimentelle Medizin. 1924;41:180-237
1924 – Einthoven awarded the Nobel Prize in Physiology or Medicine 1924 for his ‘discovery of the mechanism of the electrocardiogram‘.
1930 – Wolff L, Parkinson J, and White PD publish the eleven cases as definitive description of the syndrome – ‘Bundle Branch Block with Short P-R Interval in Healthy Young People Prone to Paroxysmal Tachycardia.’ Retrospective review of published case reports looking for evidence of ventricular preexcitation shows the earliest example of WPW published is from 1909 by August Hoffmann (1862-1929) published in MMW 1909; 56(2): 2259-2262.
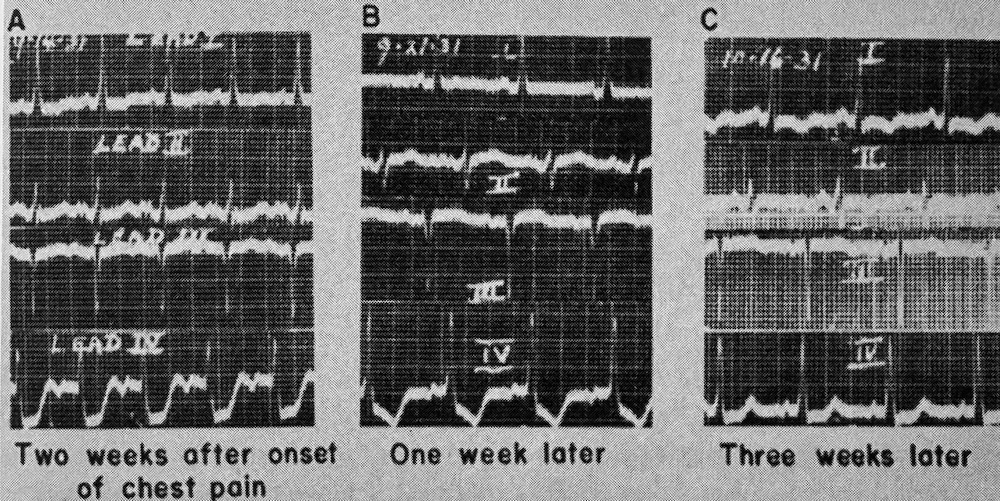
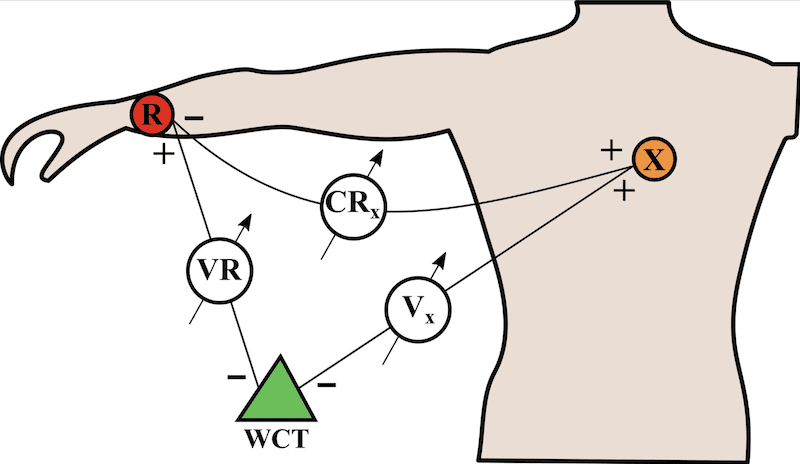
1931 – Charles C. Wolferth (1887-1965) and Francis Clark Wood (1901-1990) introduce the precordial lead (lead IV) in clinical diagnostic cardiology. Precordial leads had previously been used by Waller, whose capillary electroscope was too insensitive to detect the electric forces emanating from the human heart unless the electrode was placed over the precordium as near to the heart as possible.
Frank Norman Wilson introduced precordial lead IV in 1931
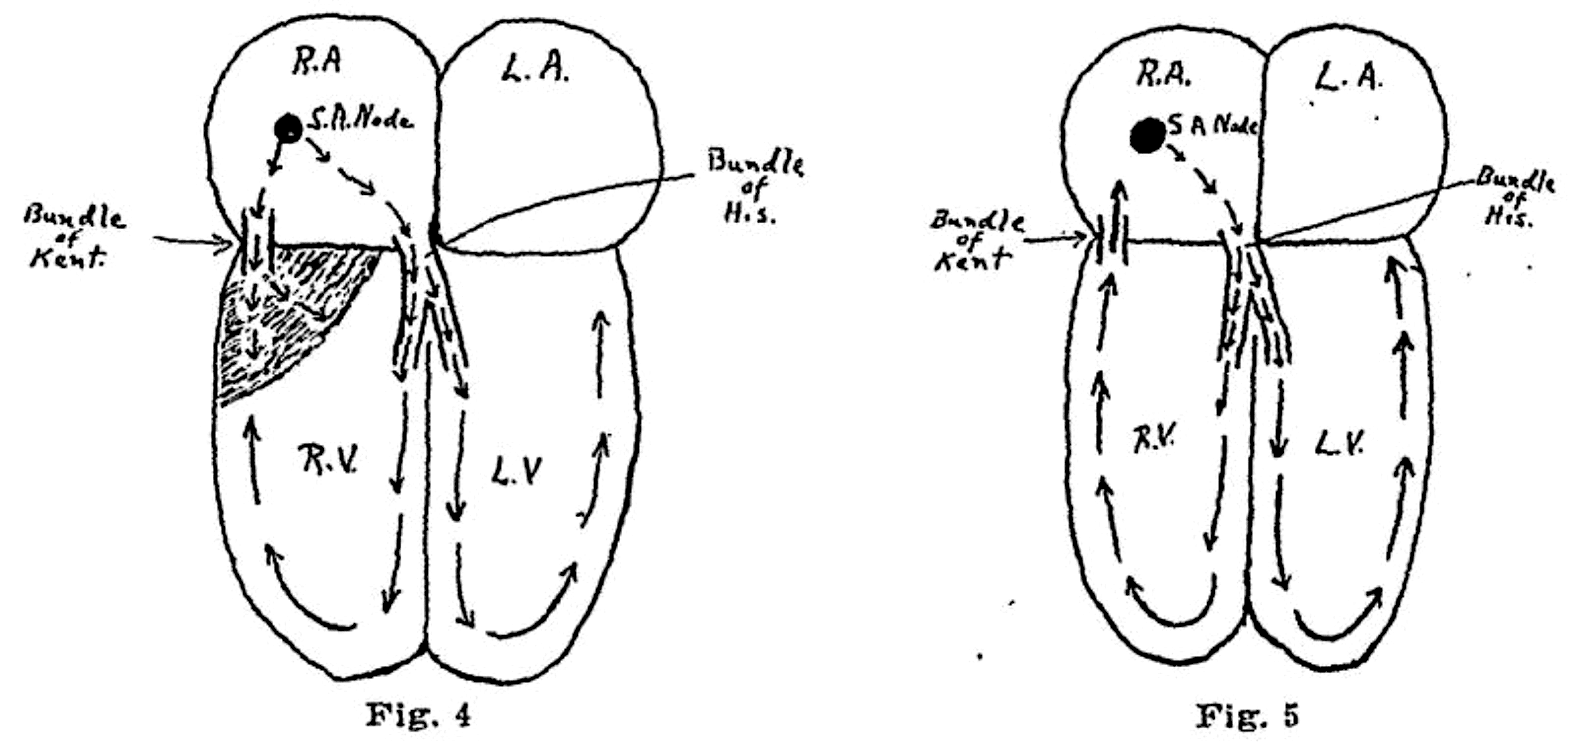
1933 – Wolferth and Wood suggested that the abnormal slurring of the initial part of the QRS complex in Wolff-Parkinson-White syndrome, and prolongation of the QRS complex were not due to bundle-branch block but to:
…an actual acceleration of the passage of the impulse from the auricle to a section of the ventricle…in keeping with the possibility that an accessory pathway of AV conduction such as described by Kent (1913) between the right auricle and right ventricle could be responsible for the phenomenon manifested by these cases
Wolferth CC, Wood FC. 1933
Wolferth CC, Wood FC. 1933
1937 – Louis Nelson Katz (1897 – 1973) and Hans Wachtel (1909 – 1977) described large biphasic QRS complexes (tall R waves + deep S waves) in V2-5. Classic ECG pattern of Biventricular Hypertrophy, most commonly seen in children with ventricular septal defect (VSD). Known as Katz-Wachtel phenomenon. [The diphasic QRS type of electrocardiogram in congenital heart disease. Am Heart J; 1937; 13: 202-206.]
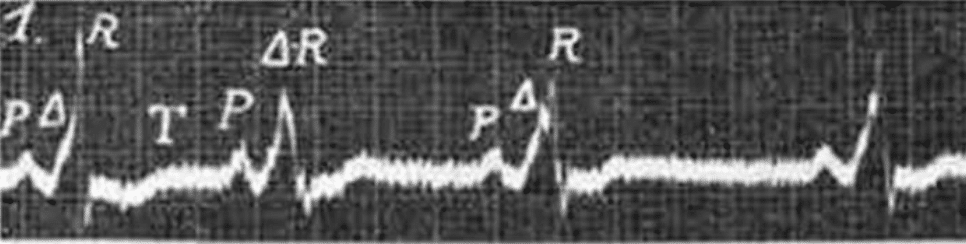
1944 – Marcel Segers with colleagues J. Lequime and H. Denolin proposed the symbol Δ to represent the triangle shape at the base of the upsloping QRS complex in pre-excitation syndromes. They described the ‘… deformation of the PQ segment is the result of a supplementary electrical deflection that we propose to call Δ‘ . This became more commonly described as the ‘delta wave‘. [L’activation ventriculaire précoce de certains cœurs hyperexeitables. Étude de I’onde Δ de I’électrocardiogramme. Cardiologia. 1944;8(3-4):113-167.]
1947 – Claude Schaeffer Beck (1894-1971) successfully defibrillated a human heart a mere 137 years after treatment by electric shock in cases of cardiac arrest (syncope anginosa) was suggested by Scottish anatomist and surgeon Allan Burns (1781-1813)
1949 – Norman “Jeff” Holter (1914-1983) invented ambulatory electrocardiography. This first ECG radio transmitter with batteries weighed more than 38 kg. The first broadcast of a radioelectrocardiogram (RECG) in 1949
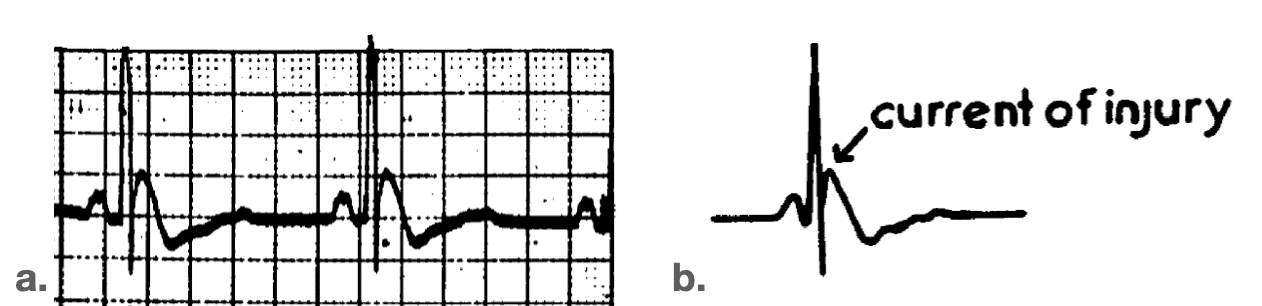
1953 – John J Osborn (1917-2014) studied the effect of hypothermia on the respiratory and cardiac function in dogs. Experimentally-induced hypothermia caused the development of a distinct deflection at the J point on the ECG and resulted in ventricular fibrillation. He termed this deflection the ‘current of injury’. Although the prominent J deflection attributed to hypothermia was first reported in 1938 by Tomaszewski, it is most commonly called the Osborn wave. [Experimental hypothermia; respiratory and blood pH changes in relation to cardiac function. Am J Physiol. 1953]
1957 – Norwegian Professor of Cardiology, Anton Jervell (1901-1987) with his colleague and jazz virtuoso Fred Lange-Nielsen (1919-1989) describe an autosomal recessive syndrome of long-QT interval with severe, bilateral sensorineural hearing loss and sudden death – Jervell and Lange-Nielsen syndrome (JLNS). [Congenital deaf-mutism, functional heart disease with prolongation of the Q-T interval and sudden death. Am Heart J. 1957]
1963 – Cesarino Romano (1924-2008) in 1963 and Owen Conor Ward (1923 – ) in 1964, independently report an autosomal dominant long QT syndrome (LQTS) without congenital hearing loss. Now known as Romano-Ward syndrome.
1966 – François Dessertenne (1917-2001) publishes the first case of ‘torsades de pointes’ – La tachycardie ventriculaire à deux foyers opposés variables in Archives des Maladies du Cœur et des Vaisseaux 1966; 59(2): 263–272
1967 – Professor Frank Pantridge (1916-2004) inventor of the first Western portable defibrillator (1965) and published a report of the first pre-hospital resuscitation using the mobile coronary care unit (MCCU) in Belfast [A mobile intensive-care unit in the management of myocardial infarction. Lancet. 1967]
1967 – The “Minnesota code” for ECG classification. Adaptation to CR (CH) leads and modification of the code for ECGs recorded during and after exercise
1976 – Erhardt, Sjögren and Wahlberg describe the use of a right sided precordial lead (CR4R or V4R) in the diagnosis of right ventricular infarction which had previously thought to be electrocardiographically silent. [Single right-sided precordial lead in the diagnosis of right ventricular involvement in inferior myocardial infarction. Am Heart J. 1976]
1970 – Uhley HN. [Electrocardiographic telemetry from ambulances. A practical approach to mobile coronary care units. Am Heart J. 1970]
1977 – The epsilon waves observed in 30% of patients with arrhythmogenic right ventricular dysplasia were first defined and described by Guy Fontaine (1936-2018). The waves may be seen more readily using Fontaine bipolar precordial leads (F-ECG).
1978 – Alois Langer, Marlin Heilman, Morton Mower and Mieczyslaw Mirowski patented a “Circuit for monitoring a heart and for effecting cardioversion of a needy heart” (US Patent #4184493). The start of the development of the implantable cardiac defibrillator. [A chronically implanted system for automatic defibrillation in active conscious dogs. Experimental model for treatment of sudden death from ventricular fibrillation. Circulation 1978;58:9094.]
1996 – Elena B. Sgarbossa develops and validates a Sgarbossa prediction rule based on a set of ECG criteria for the diagnosis of acute myocardial infarction in patients with chest pain and left bundle-branch block. SW Smith (2012) modifies the third component of the original criteria criteria from absolute (>5mm discordant ST elevation) to proportional (any ST segment to S-wave ratio less than -0.25, with at least 1 mm ST elevation) improved prediction of acute coronary occlusion.
2005 – Assessing the diagnostic value of an ECG containing leads V4R, V8, and V9: the 15-lead ECG. Zalenski RJ et al Ann Emerg Med. 1993
2008 – The de Winter ECG pattern was first reported in a 2008 case series by de Winter RJ, Verouden NJ, Wellens HJ et al. They observed this ECG pattern in 30 / 1532 patients with acute LAD occlusions (2% of cases).
2018 – Apple smart watch: Over 400,000 people enrol in a study being conducted by researchers at Stanford and Apple to determine whether a wearable technology can identify irregular heart rhythms suggestive of atrial fibrillation.
2018 – Smartphone 12‐lead ECG. Chest‐lead ST‐J amplitudes using arm electrodes as reference instead of the Wilson central terminal in smartphone ECG applications. The ECG waveforms and ST‐J amplitudes can be calculated from the V leads and the relevant augmented lead (aVR or aVL) in the conventional 12‐lead ECG. Lindow et al 2018
References
- Driscol TE, Ratnoff OD, Nygaard OF. The remarkable Dr. Abildgaard and countershock. The bicentennial of his electrical experiments on animals. Ann Intern Med. 1975; 83(6): 878-82.
- Burch GE. History of precordial leads in electrocardiography. Eur J Cardiol. 1978; 8(2): 207-36.
- Fye WB. A history of the origin, evolution, and impact of electrocardiography. Am J Cardiol. 1994; 73(13): 937-49.
- Hurst JW. Naming of the waves in the ECG, with a brief account of their genesis. Circulation. 1998 Nov 3;98(18):1937-42.
- Kuijpers PJMC. History in medicine: the road to clinical electrophysiology. e-Journal of Cardiology Practice. 2021; 21(13-15)
- Zimmerman FH. A Brief History of Clinical Electrocardiography: A Century After Einthoven’s Nobel Prize. Cardiol Rev. 2026 Mar-Apr 01;34(2):178-185.
eponymythology
the myths behind the names

BA MA (Oxon) MBChB (Edin) FACEM FFSEM. Emergency physician, Sir Charles Gairdner Hospital. Passion for rugby; medical history; medical education; and asynchronous learning #FOAMed evangelist. Co-founder and CTO of Life in the Fast lane | On Call: Principles and Protocol 4e| Eponyms | Books |